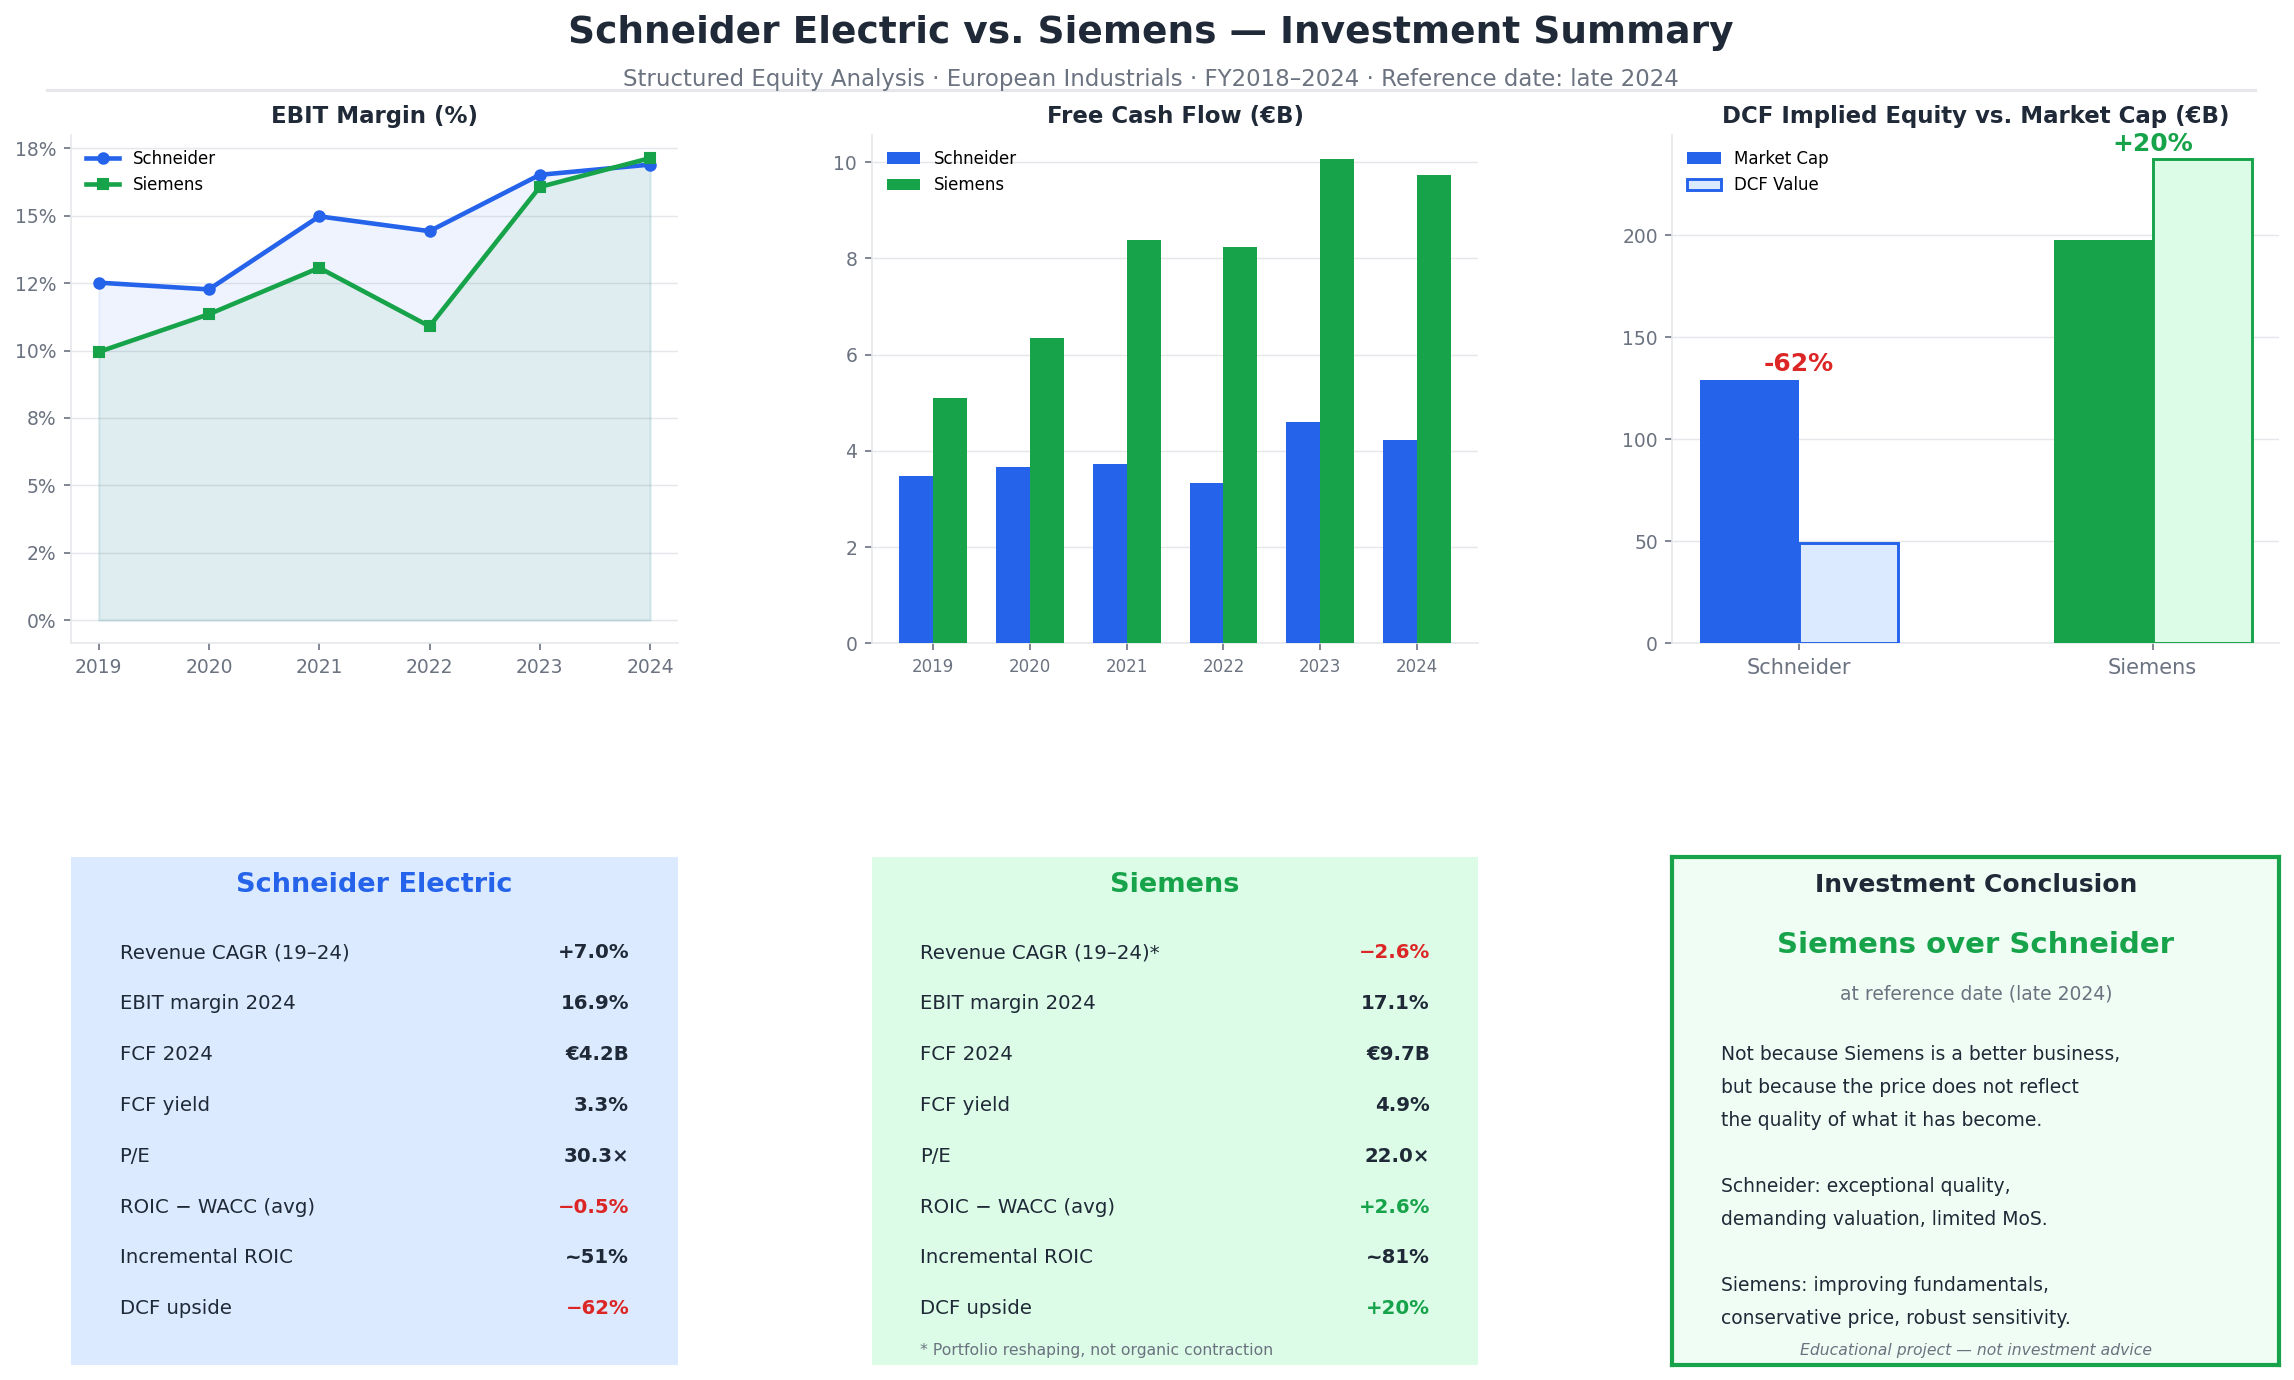
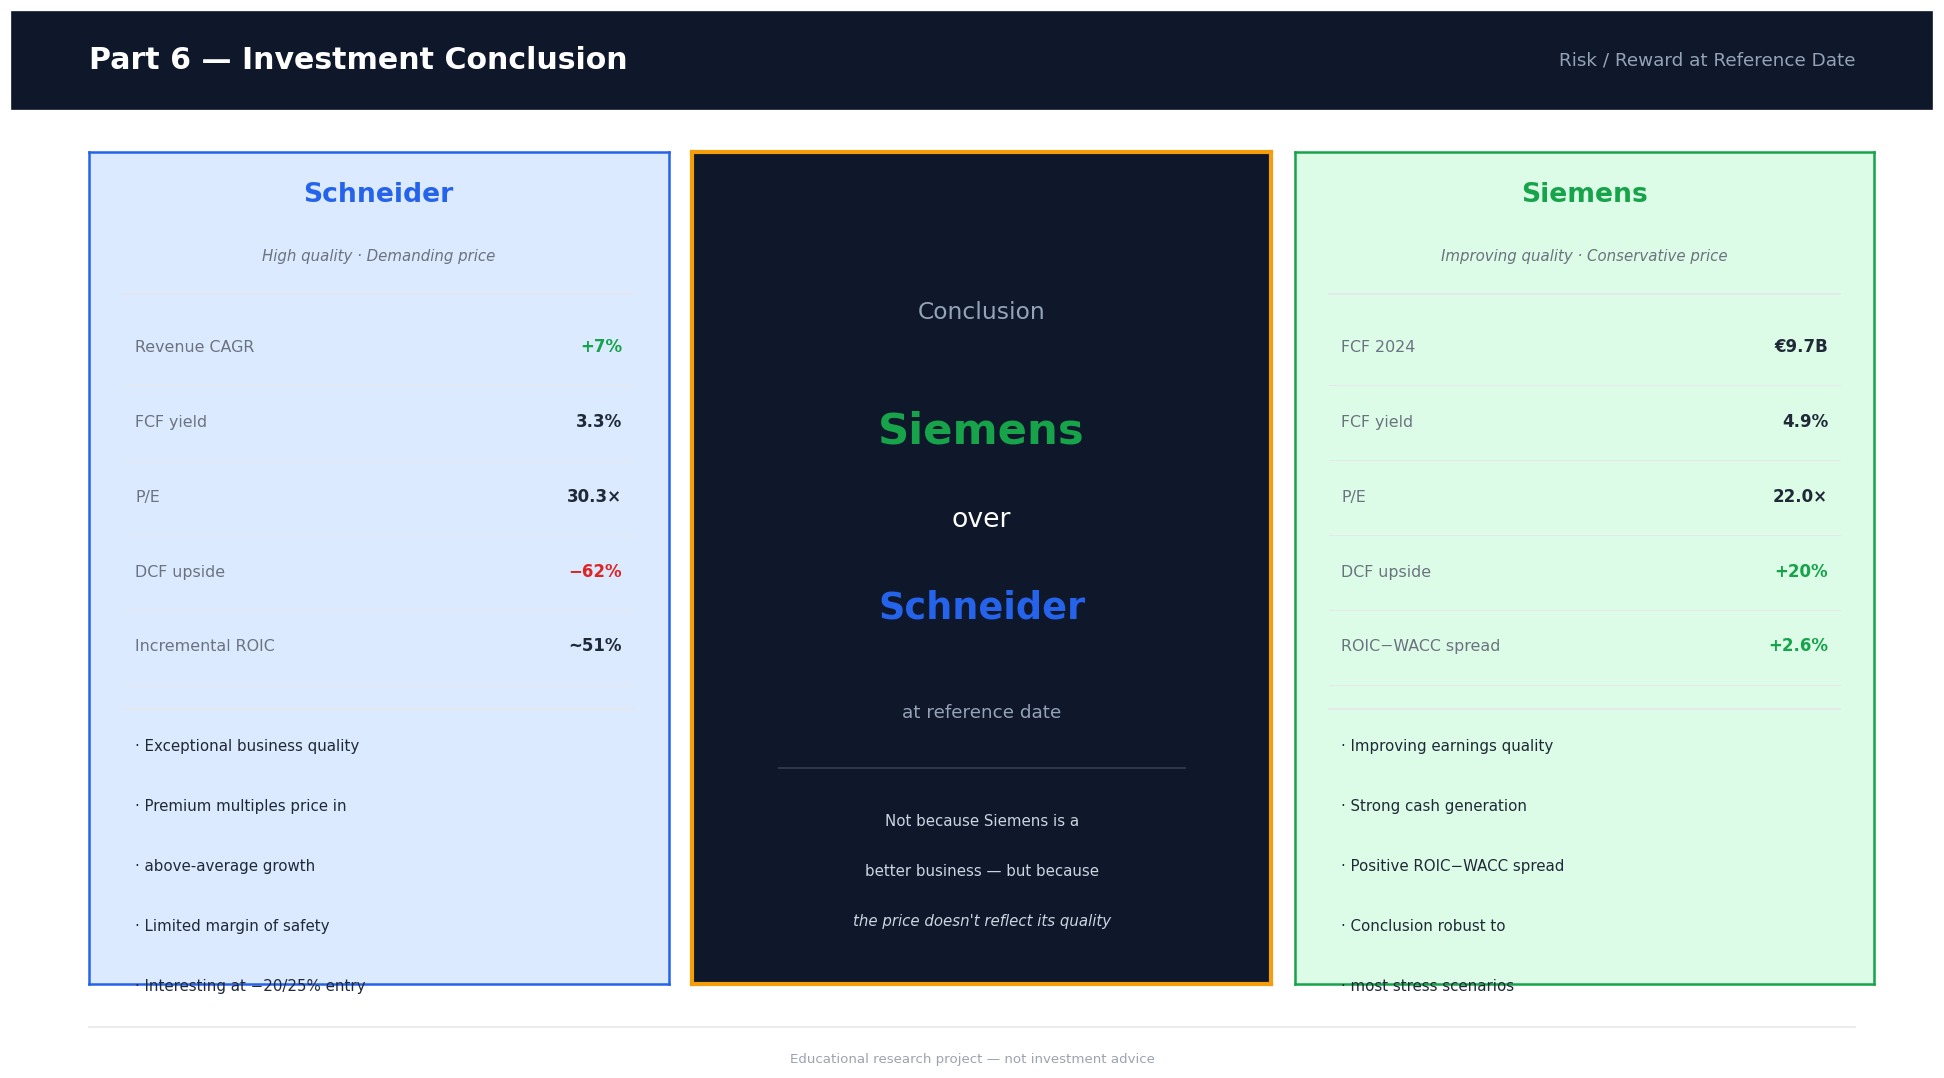
Siemens offers the more attractive risk/reward profile: DCF implies ~+20% upside vs. current market cap, with a conclusion that holds across most stress scenarios.
Schneider is an exceptional business, but trades at a premium where the entire investment case depends on above-average growth continuing. Limited margin of safety.
What this project shows
A repeatable equity research workflow applicable to any sector
How to separate reported figures from comparable business economics
Disclaimer: this is an educational research project and does not constitute investment advice.
Executive Summary — From Noise to Process
Most retail investors approach the market without a repeatable framework: they react to news, follow tips, and build portfolios on
narratives that cannot be stress-tested or improved. The core issue is not access to data — financial information has never been more
accessible — but the absence of structure, especially at two key decision points: where to look (sector selection)
and what to buy (company-level valuation).
This project applies a professional analyst workflow to a real case: European industrials in late 2024, when a shifting rate
environment after two years of ECB tightening, increasing selectivity within the energy transition, and compressed valuations
relative to US peers created the conditions for disciplined stock selection to identify genuine mispricing. Two companies —
Schneider Electric and Siemens — were selected as the ideal comparison pair: same sector, same structural tailwinds, same reporting
currency, but fundamentally different financial profiles and market valuations.
The goal is not prediction. It is a replicable framework for identifying mispricing, defining
margin of safety, and stating clearly what would need to be true for each thesis to hold.
Analytical Framework
Equity selection is treated as a sequential, replicable workflow:
1) Sector rationale → identify the right hunting ground 2) Company selection → choose comparable firms (same tailwinds/exposure) 3) Financial analysis → growth, margins, cash conversion, balance sheet 4) Valuation → DCF (anchor) + multiples cross-check 5) Sensitivity → test robustness across key assumptions 6) Investment conclusion → risk/reward + conditions for thesis change
Part 1 — Investment Universe & Sector Rationale
Why European Industrials, Why Now (late 2024)
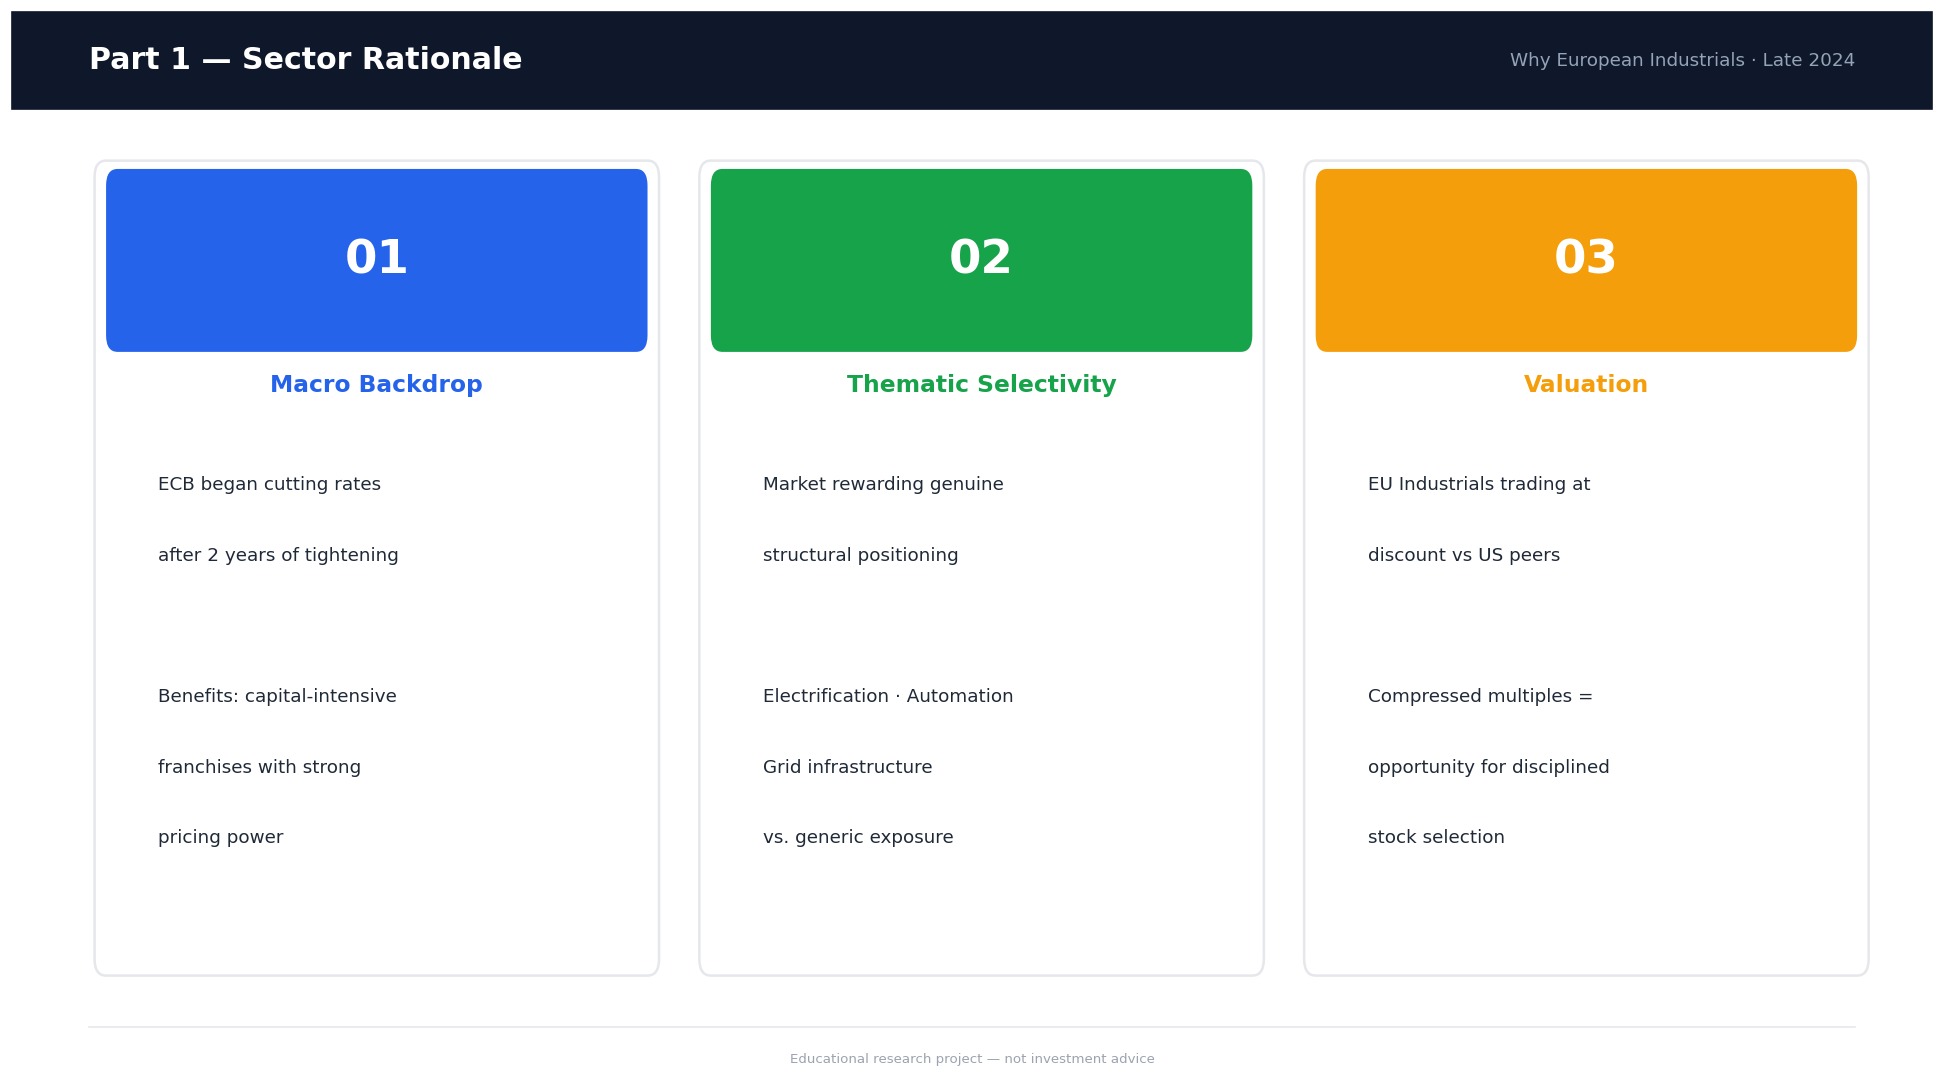
As of late 2024, three dynamics were converging to make European industrials a compelling hunting ground for bottom-up investors:
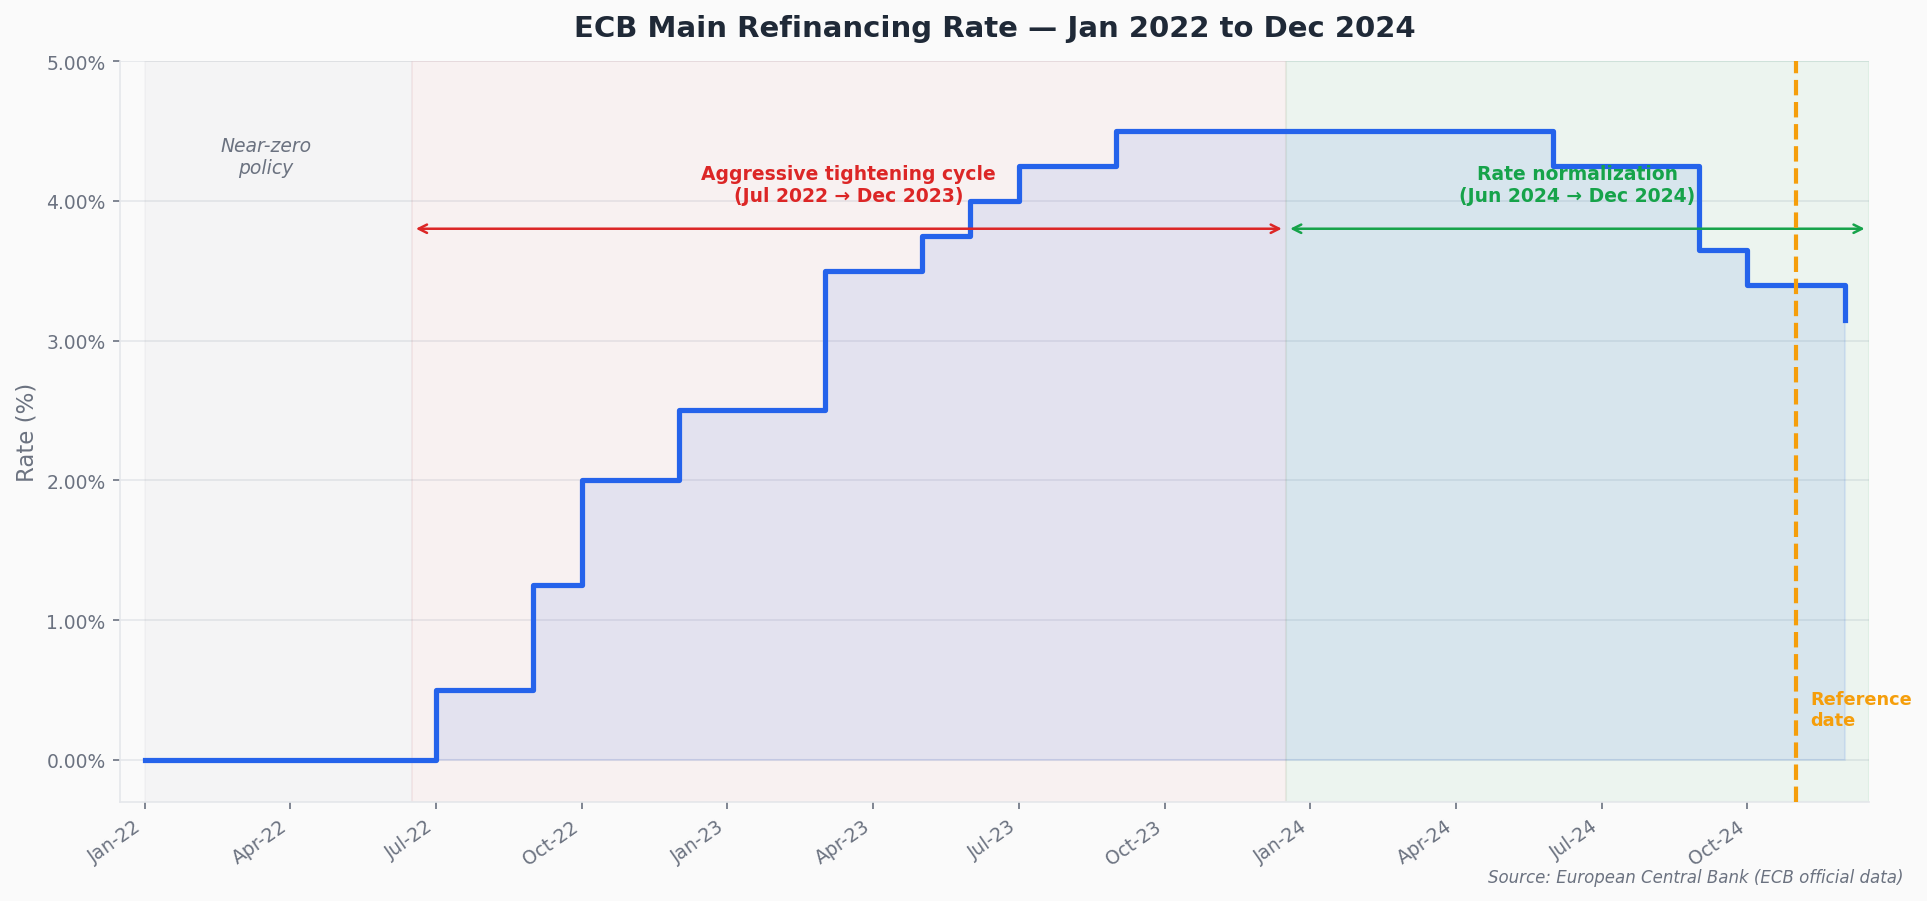
Macro backdrop. The ECB had begun cutting rates after two years of aggressive tightening. Historically, early-phase
rate normalization benefits companies with strong pricing power and high capital intensity: lower financing costs improve the
economics of customer capex decisions, which flows directly into order intake for industrial equipment and automation suppliers.
European industrial franchises sit squarely in that category.
Thematic selectivity. The broad enthusiasm around the energy transition of 2021–2022 had given way to a more
discriminating market. Investors were no longer rewarding generic thematic exposure. The market was starting to distinguish
companies with genuine structural positioning in electrification, grid infrastructure, and industrial automation from those with
more peripheral or commoditized exposure — precisely the environment where fundamental analysis can surface valuation gaps that
narrative-driven investing had obscured.
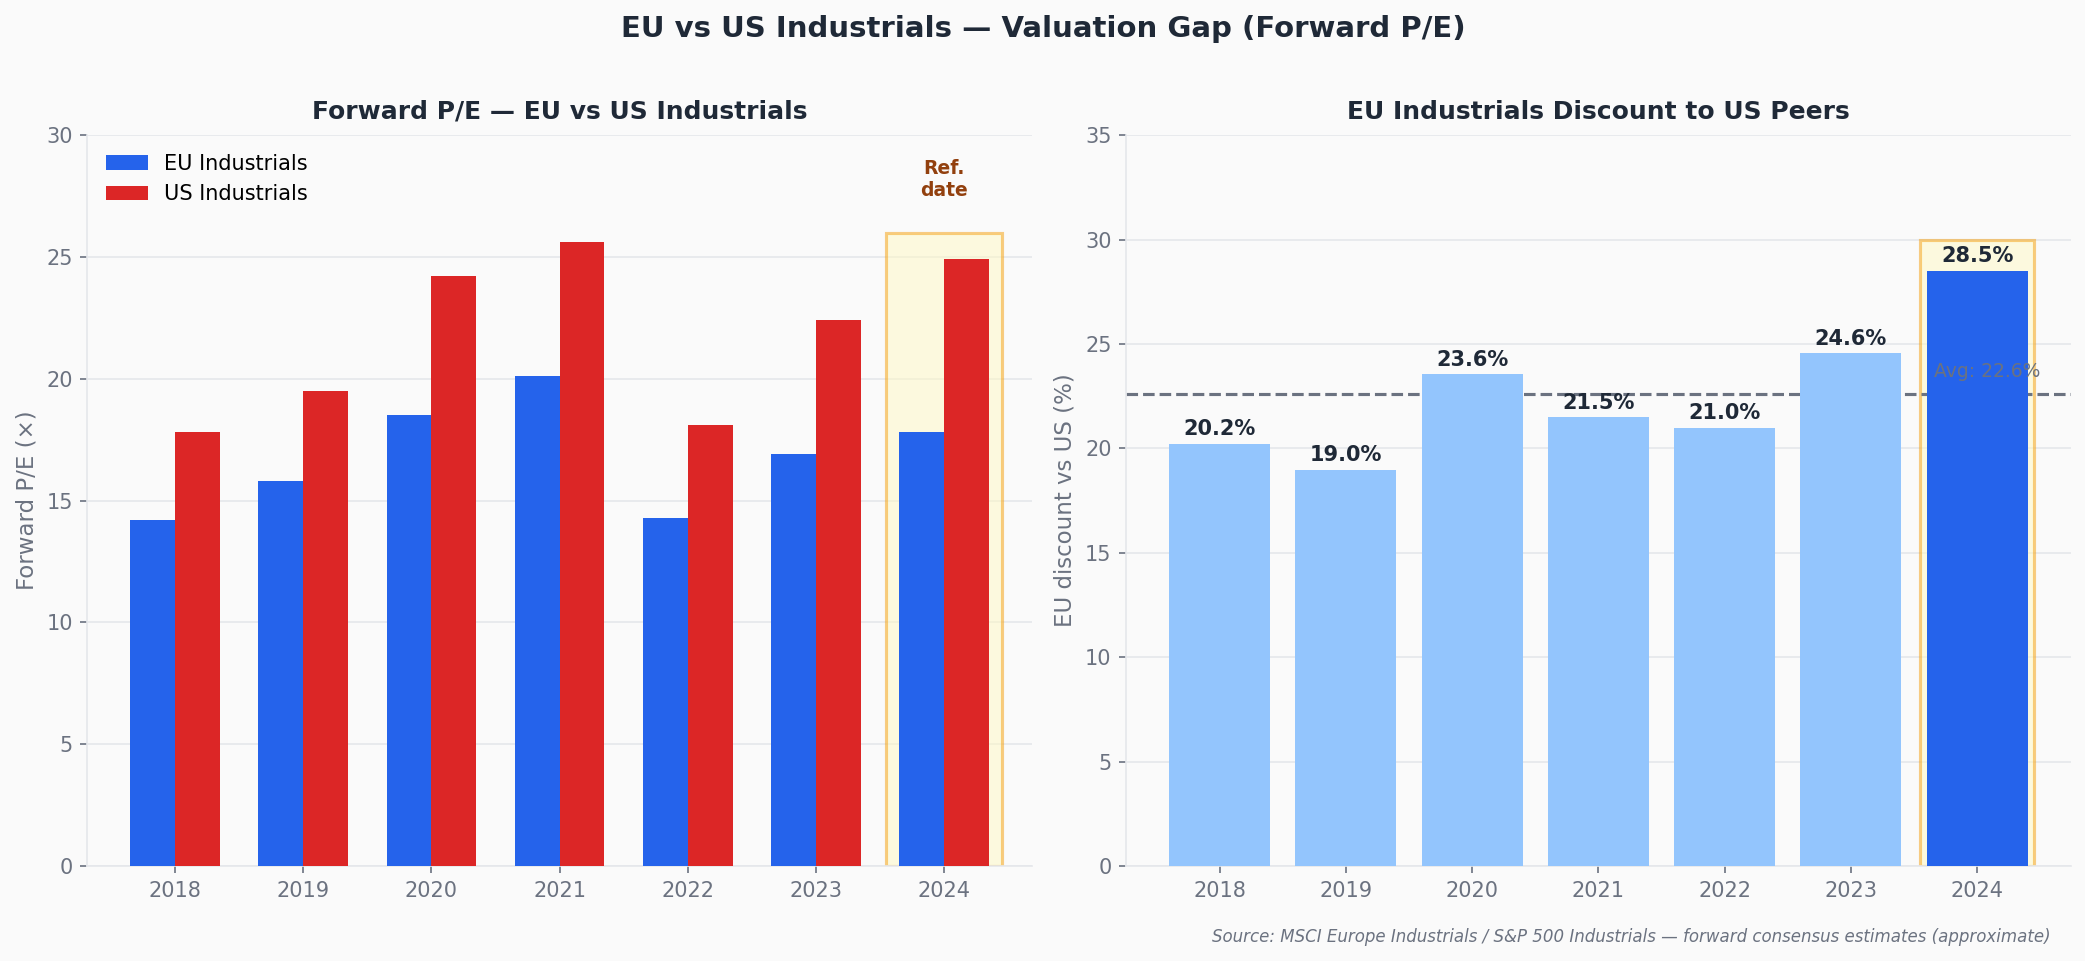
Valuation. European industrials traded at a meaningful discount to their US peers. Years of macro uncertainty
and energy cost concerns had compressed multiples across the sector, leaving several high-quality franchises priced below what
their underlying earnings power and return profiles would justify.
EU vs US industrial valuation gap at reference date.
ECB rate backdrop — early normalization cycle at late 2024.
Part 2 — Company Selection
Why Schneider Electric and Siemens
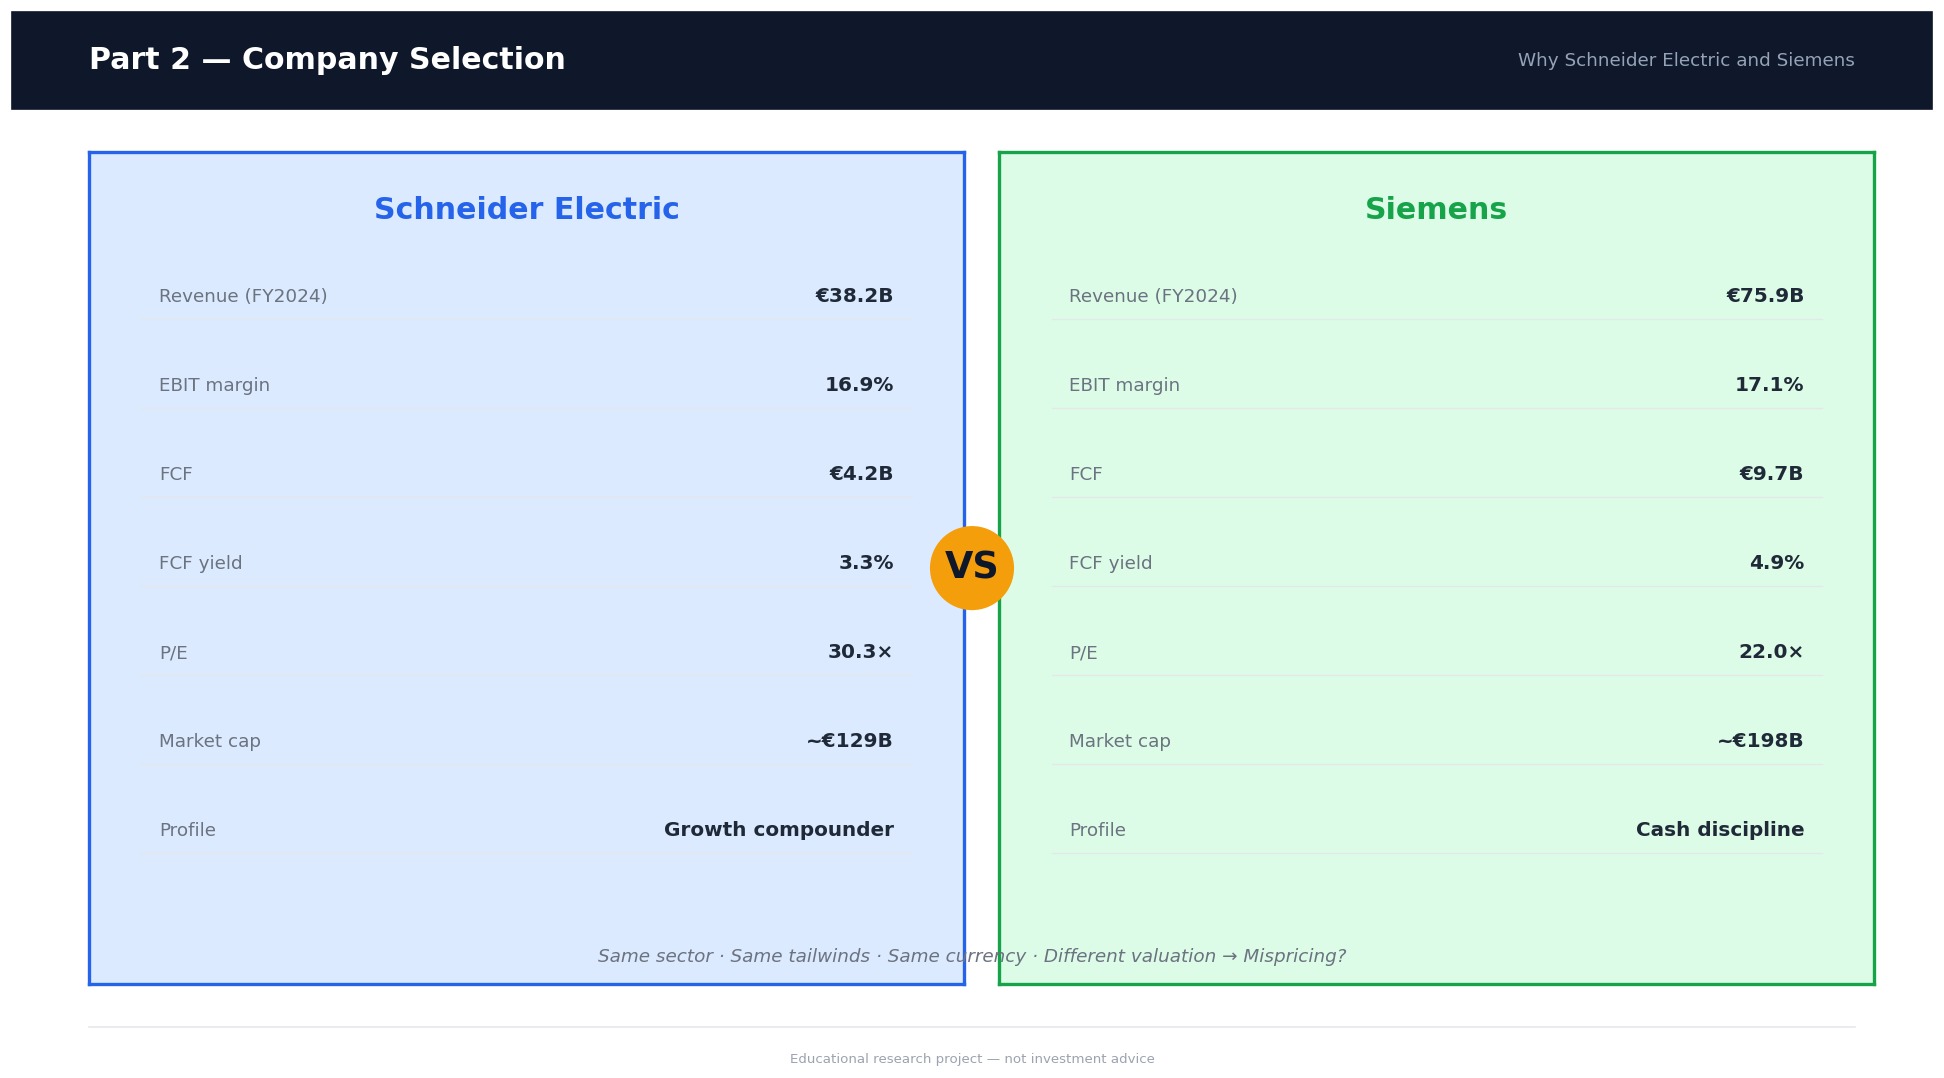
The pair is intentional. Both companies operate in the European industrial space, both are exposed to the same structural tailwinds
(electrification, automation, digitalization of industrial infrastructure), and both report in euros — removing currency distortion
from the comparison. That overlap is deliberate: when two companies share the same macro exposure and end markets, any valuation
difference has to be explained by something fundamental — growth trajectory, capital efficiency, earnings quality, or management
discipline. Finding that explanation is what the analysis sets out to do.
Both are large-cap and widely covered, which means any mispricing requires a specific, defensible argument rather than a simple
"cheap vs expensive" observation. The more interesting reason for choosing these two, however, is their contrasting financial profiles
despite operating in the same sector: Schneider is a growth-oriented compounder, Siemens a capital-discipline and cash-generation
story. That contrast makes the comparison analytically rich.
Peer Snapshot (FY2024)
Metric
Schneider
Siemens
Revenue
€38.2B
€75.9B
EBIT
€6.4B
€13.0B
EBIT margin
16.9%
17.1%
Free cash flow
€4.2B
€9.7B
FCF margin
11.0%
12.8%
Market cap (ref. date)
~€129B
~€198B
EV / EBIT
21.3×
18.2×
P/E
30.3×
22.0×
FCF yield
3.3%
4.9%
Note: market data as of late 2024 reference date. All figures in euros.
Part 3 — Financial Analysis (FY2018–FY2024)
Seven years of audited financials were analyzed for both companies. A key objective throughout is to separate reported headline
figures from comparable underlying business economics — particularly for Siemens, where portfolio reshaping creates significant
noise in the historical numbers.
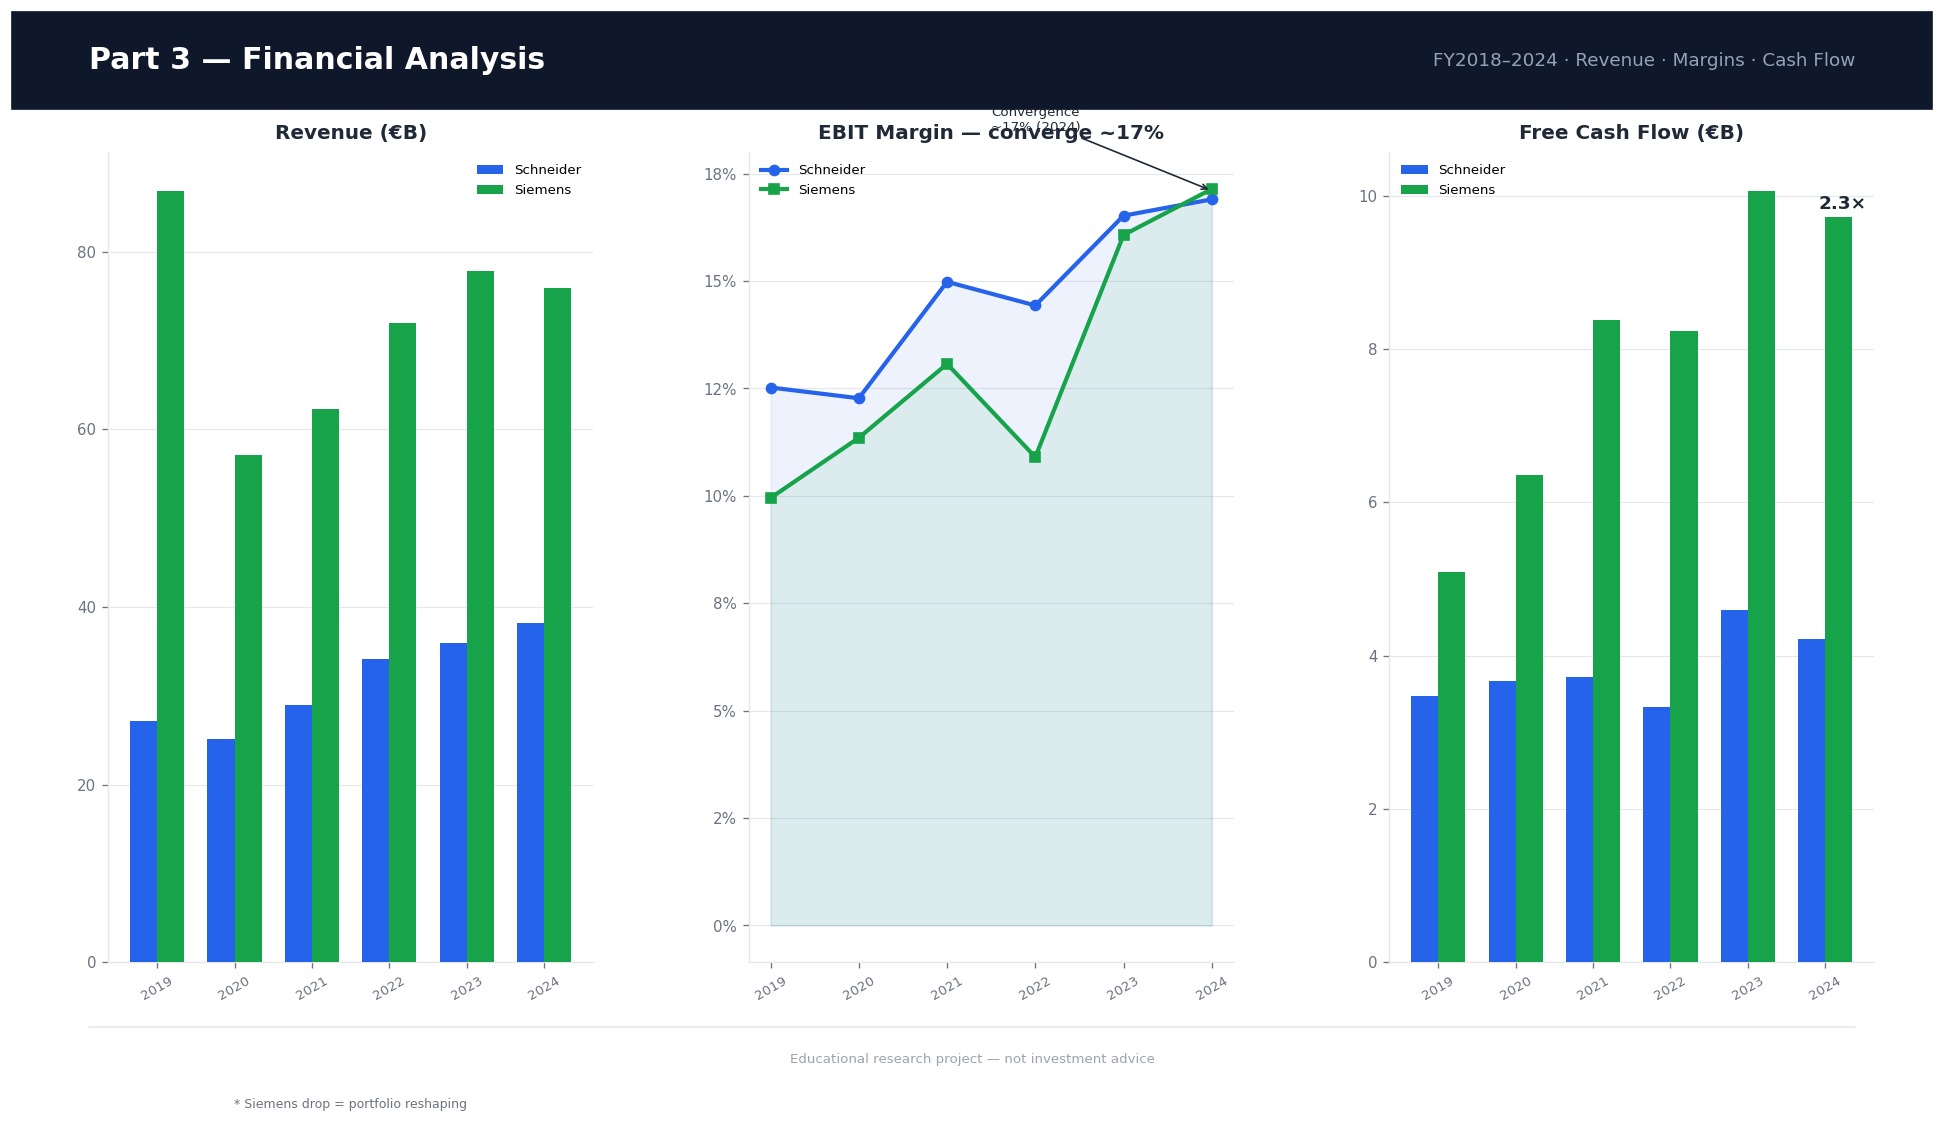
3.1 — Revenue & Growth Profile
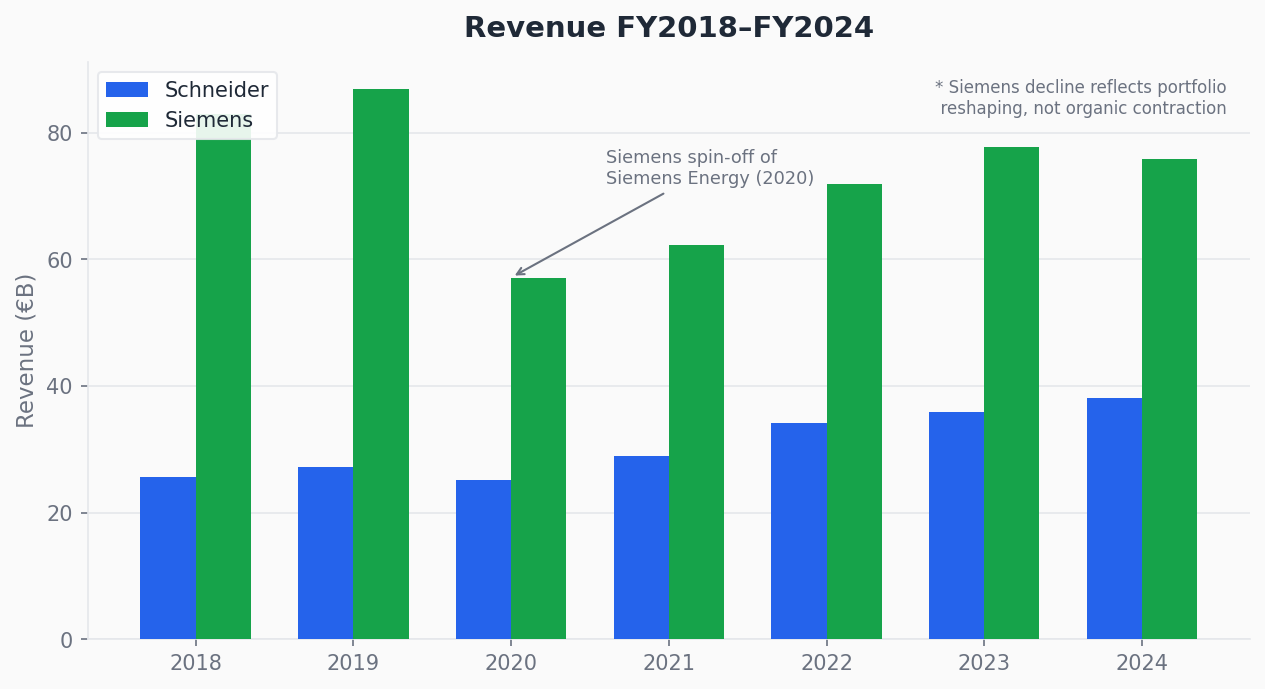
Schneider grew revenue from €27.2B (2019) to €38.2B (2024), a CAGR of ~7%. Growth was broad-based and consistent
across years, accompanied by margin expansion simultaneously — a combination that points to genuine operating leverage rather than
volume-driven inflation.
Siemens shows a headline revenue CAGR of approximately −2.6% over the same period (€86.8B in 2019
to €75.9B in 2024). This figure is misleading. It reflects two deliberate portfolio decisions — the spin-off of Siemens Energy in
September 2020 and the gradual separation of other non-core businesses — rather than any organic contraction. On a continuing
operations basis, the underlying industrial business grew steadily throughout the period. Reading the headline CAGR without this
context leads to the wrong conclusion: a negative CAGR driven by portfolio reshaping is fundamentally different from one driven by
market share loss.
3.2 — Profitability & Margin Expansion
Schneider: EBIT grew from €3.4B (2019) to €6.4B (2024), a CAGR of ~13.5% — nearly double the revenue growth rate.
EBIT margin expanded from 12.5% to 16.9%, an improvement of +440 basis points over five years. This was a
sustained trend driven by pricing power, a gradual mix shift toward higher-margin software and services, and operational efficiency
improvements.
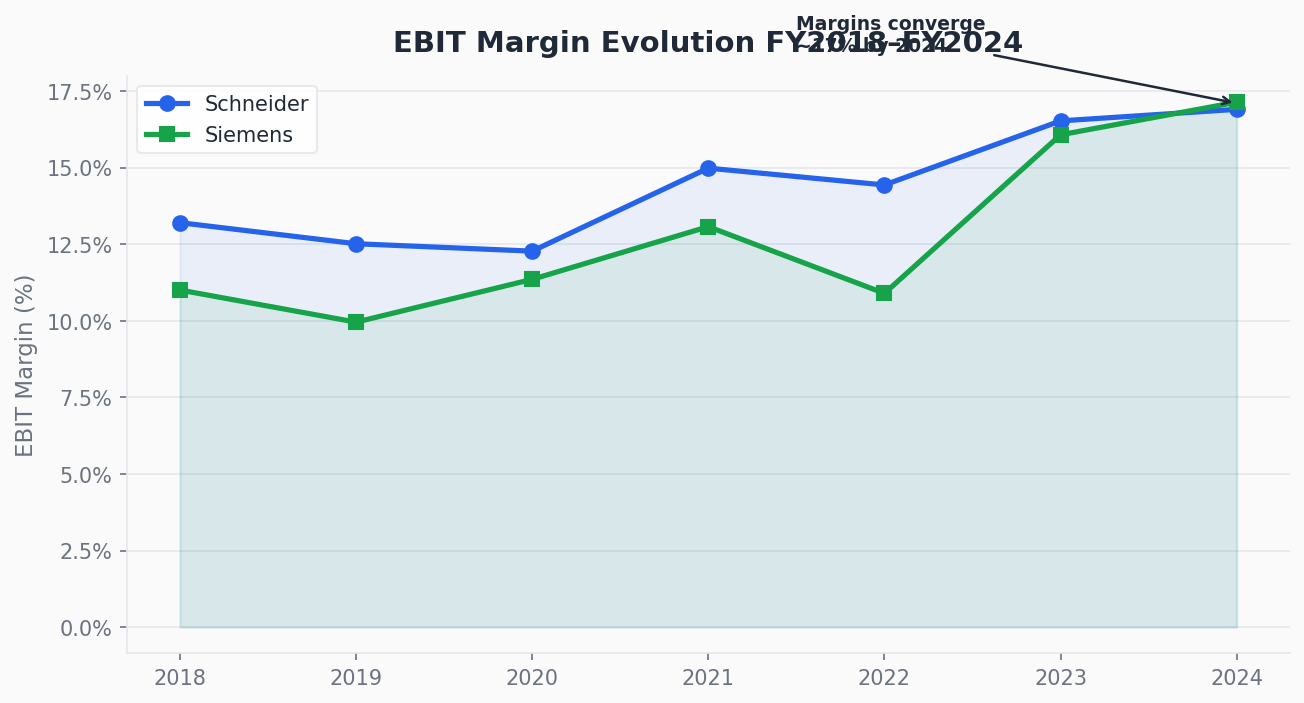
Siemens: EBIT on a continuing operations basis grew from €8.6B (2019) to €13.0B (2024), with margin expanding
from ~9.9% to 17.1% — an improvement of over +700 basis points. Crucially, this expansion happened while the
company was simultaneously divesting businesses, absorbing restructuring costs, and navigating supply chain disruptions. Margins
improving through that level of operational complexity points to genuine structural progress in the quality of the remaining
portfolio, not just the removal of low-margin divisions.
By 2024, both companies are operating at broadly similar EBIT margin levels (~17%). That convergence is one of
the most analytically interesting findings: if margins have come together, any valuation premium one company carries relative to the
other has to be justified by something other than current profitability.
3.3 — Cash Flow & Capital Discipline
Reported earnings can be shaped by accounting choices. Free cash flow is the most direct measure of what a business actually
generates, and FCF conversion (FCF / net income) is one of the most revealing numbers in any fundamental analysis.
Schneider: FCF grew from €3.5B (2019) to €4.2B (2024), FCF margin expanded from 12.8% to 11.0%, and
conversion relative to net income stayed consistently above 100% in most years — confirming reported earnings are backed by real
cash. Capex intensity remained disciplined at roughly 3.5–4.0% of revenue.
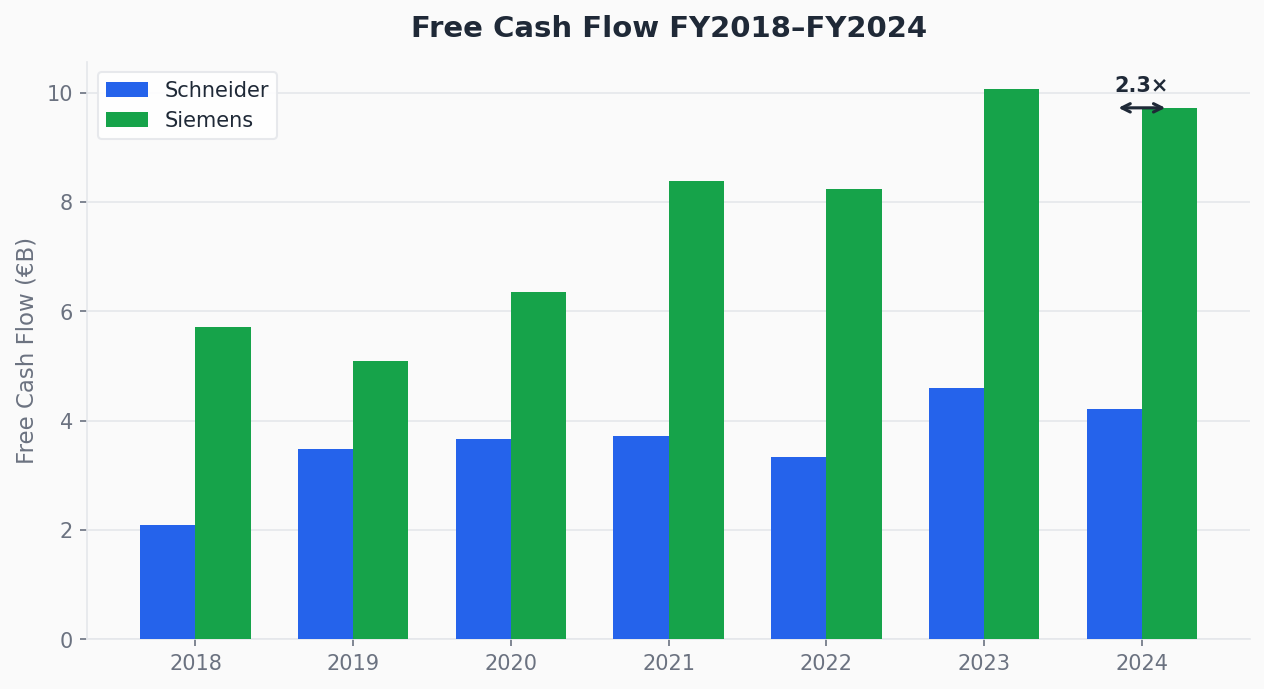
Siemens: FCF grew from €5.1B (2019) to €9.7B (2024), a CAGR of ~14%. FCF margin expanded from 5.9% to
12.8% — nearly 13 cents of every revenue euro converted to free cash by 2024, a level that compares well against
the best industrial franchises globally. In absolute terms, Siemens generates more than twice Schneider's free cash flow,
a gap that has been consistent and widening.
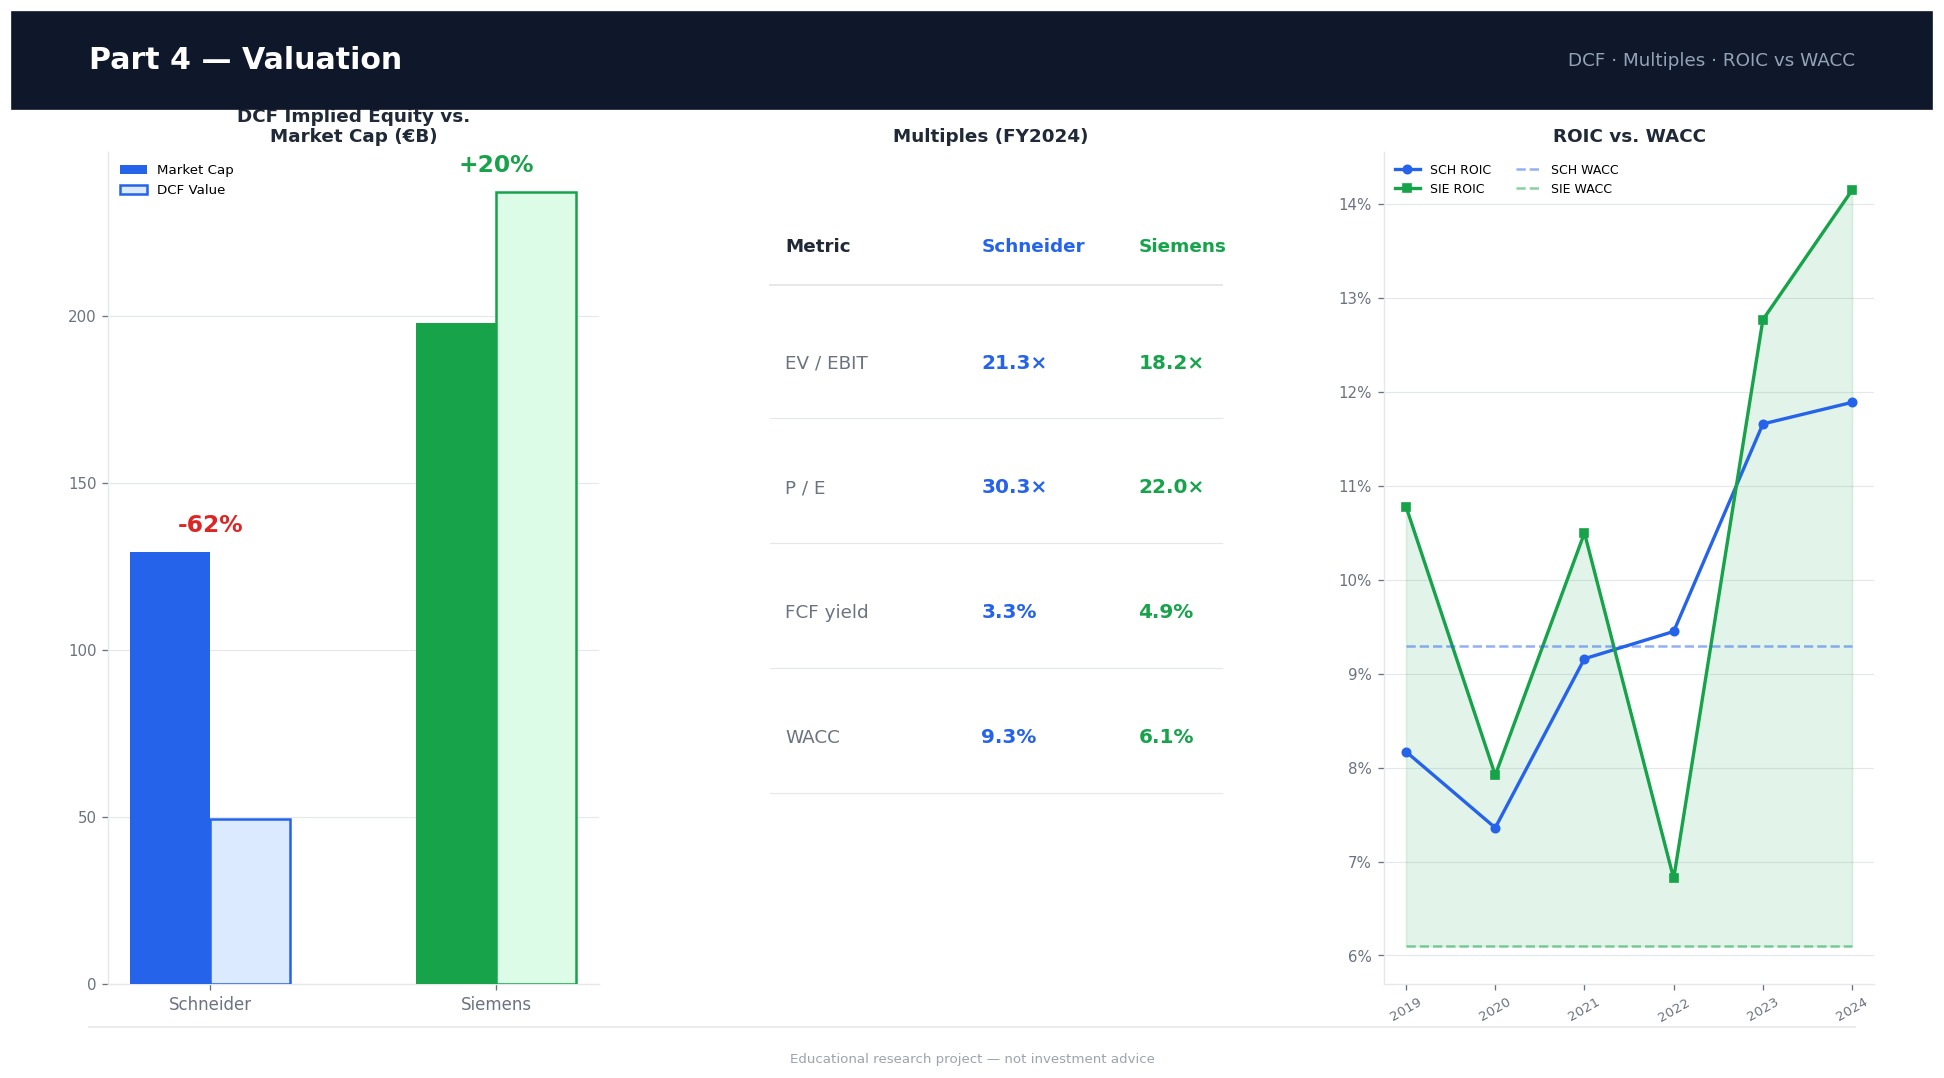
A market cap of ~€198B against €9.7B in annual FCF implies an FCF yield of ~4.9% for Siemens, versus
~3.3% for Schneider — a more attractive return floor even before considering growth.
Revenue trajectory FY2018–FY2024.
EBIT margin evolution: both converge toward ~17% by 2024.
FCF absolute (€B): Siemens generates 2× Schneider by 2024.
3.4 — Balance Sheet Notes
Schneider carried net debt of ~€7.9B at end-2024 (net debt / adj. EBITA ~1.2×), a conservative leverage level
for a company of this cash generation capacity. The balance sheet was more stretched in 2022 following the full Aveva acquisition
but has since normalized.
Siemens requires additional care due to the consolidation of Siemens Financial Services, a captive financial arm
that holds significant financial assets and liabilities. On a group basis, net debt stood at ~€38.8B at end-2024 — a large number
in absolute terms, but sitting alongside nearly €10B in annual FCF generation. The capacity to deleverage, if prioritized, is
significant. Neither company carries a balance sheet that represents a near-term financial risk.
Part 4 — Valuation
Approach
Valuation is treated as a structured judgement, not a calculation. The primary anchor is a discounted cash flow model with explicit
assumptions on growth, margins, and cost of capital. This is cross-checked using market multiples (EV/EBIT, P/E, FCF yield), then
stress-tested through a sensitivity analysis. No single lens is sufficient on its own — used together, they produce a range of
reasonable values rather than a false-precision point estimate.
Cost of Capital (WACC)
Company
Beta
Cost of Equity
Cost of Debt
WACC
Schneider
1.10
10.6%
3.5%
~9.3%
Siemens
1.18
8.9%
3.7%
~6.1%
Risk-free rate: 10Y German Bund at reference date (4.0% for Schneider, 2.7% for Siemens). Equity risk premium: 6.0% and 5.25% respectively.
The ~320bps gap in discount rates has a material impact on DCF outputs and is a structural reason the two stocks trade at different multiples.
DCF Results — 5-Year Free Cash Flow Model
The model projects five years of free cash flow for each company, applies a terminal value (perpetuity growth at 2.0%), discounts the
full stream at the respective WACC, and subtracts net debt to arrive at implied equity value vs. current market capitalization.
Input / Output
Schneider
Siemens
FCF base (2024)
€4.2B
€9.7B
FCF growth assumption (5Y)
~4% (base case)
~14%
Terminal growth rate
2.0%
2.0%
WACC applied
9.3%
6.1%
Net debt subtracted
€7.9B
€38.8B
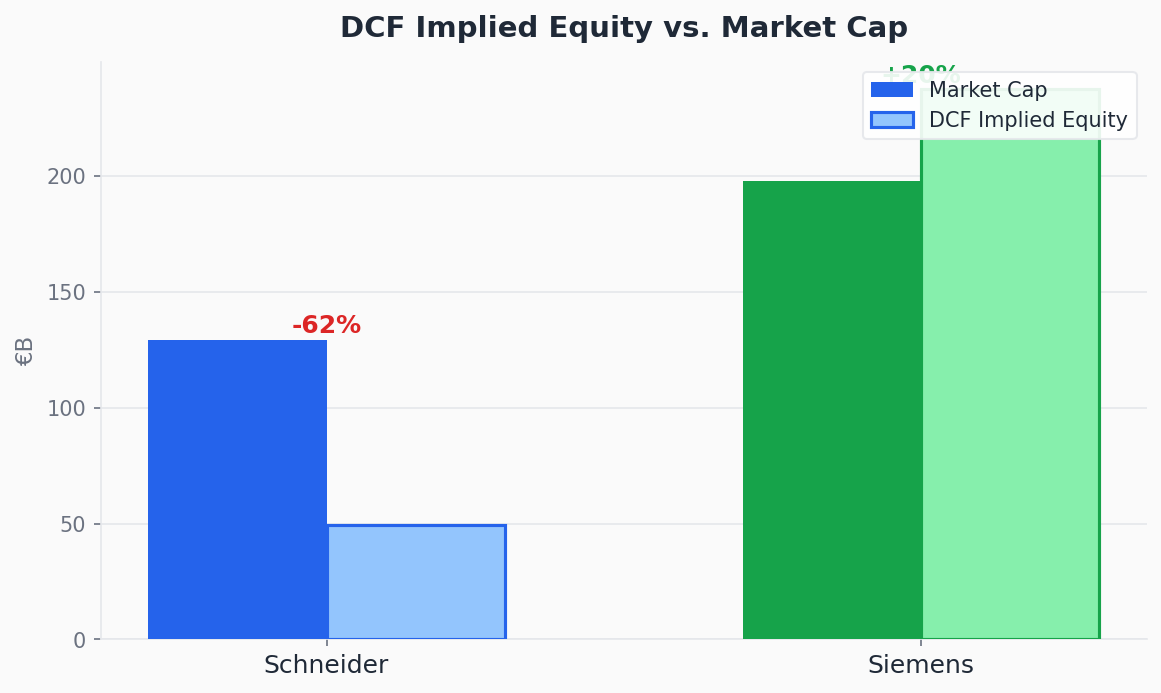
Implied equity value
~€49B
~€237B
Current market cap
~€129B
~€198B
Upside / (downside) vs. market cap
−62%
+20%
The base case DCF suggests Schneider trades at a significant premium to intrinsic value, while Siemens trades at a discount. The
conclusion is not that Schneider is a "sell" — quality businesses often trade above DCF fair value — but that the investment case
is entirely growth-dependent, with very limited margin of safety.
Multiples Cross-Check
Multiple
Schneider
Siemens
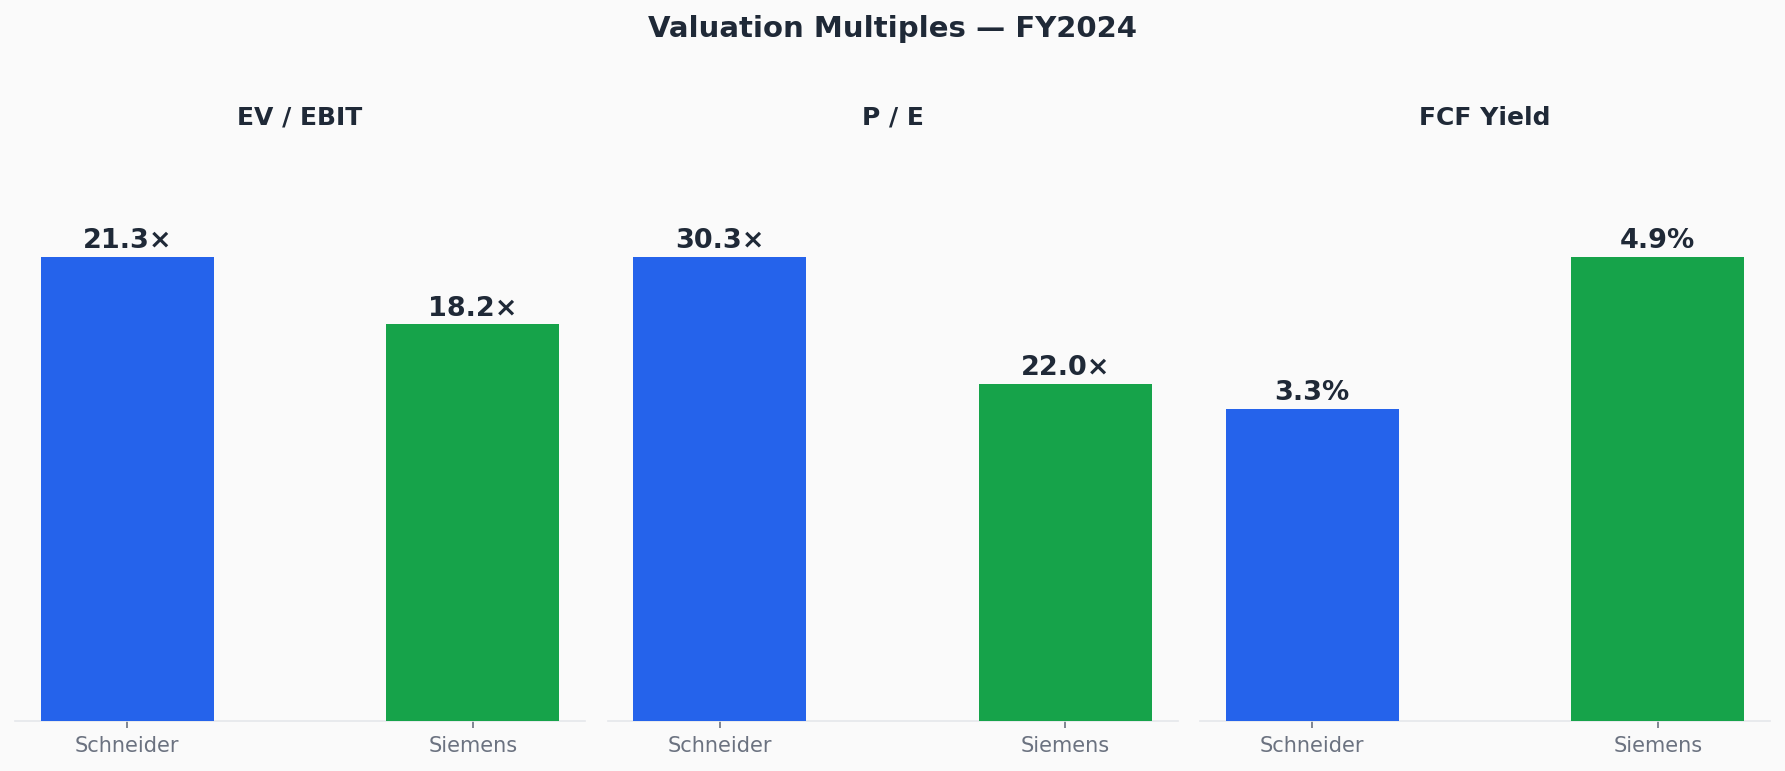
EV / EBIT
21.3×
18.2×
P/E
30.3×
22.0×
FCF yield
3.3%
4.9%
Schneider's 30× P/E and 3.3% FCF yield signal that the market has priced in a significant amount of future growth. The premium is
not irrational — it reflects genuine quality — but it is demanding and leaves little room for execution risk. Siemens' FCF yield of
4.9% provides a meaningful return floor even in a scenario where growth disappoints, which limits the downside case in a way that
Schneider's valuation does not.
Intrinsic value vs. market price — Schneider and Siemens.
Multiples snapshot: P/E, EV/EBIT, FCF yield.
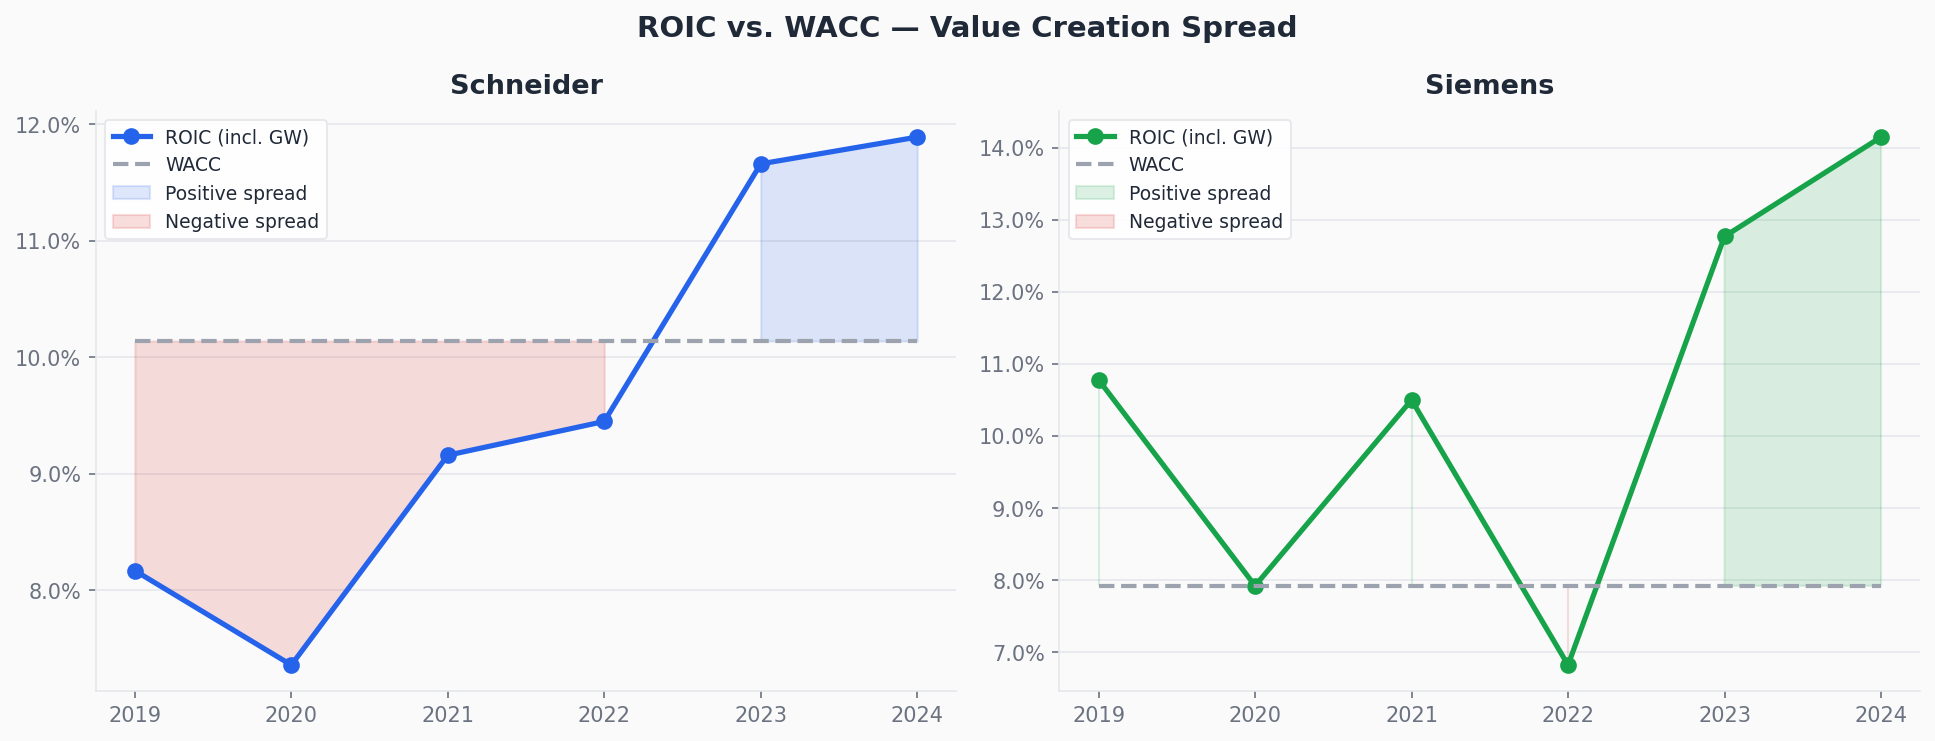
ROIC vs. WACC — Value Creation Analysis
A company creates value only when its return on invested capital exceeds its cost of capital. The spread between the two is the
most important indicator of whether a business is compounding shareholder wealth or eroding it — and it is the bridge between
operating performance and valuation.
Metric
Schneider (avg. 2019–2024)
Siemens (avg. 2019–2024)
ROIC (incl. goodwill)
~9.6%
~10.5%
ROIC (excl. goodwill)
~25.1%
~18.5%
WACC
9.3%
6.1%
ROIC − WACC spread (avg.)
−0.5%
+2.6%
Incremental ROIC (latest 3Y)
~51%
~81%
The distinction here is analytically important. Siemens has maintained a positive ROIC−WACC spread consistently
across the period, meaning it has been creating value on its existing capital stock. Schneider's average spread is slightly
negative on a fully-loaded basis (a consequence of significant goodwill from acquisitions, particularly Aveva), though the trend
is turning positive in recent years. Where Schneider stands out is its incremental ROIC of ~51% on the latest
three-year calculation — suggesting that new investment is highly accretive even if legacy goodwill weighs on the headline figure.
Both metrics are relevant; neither tells the full story alone.
ROIC vs. WACC spread over time — Schneider and Siemens.
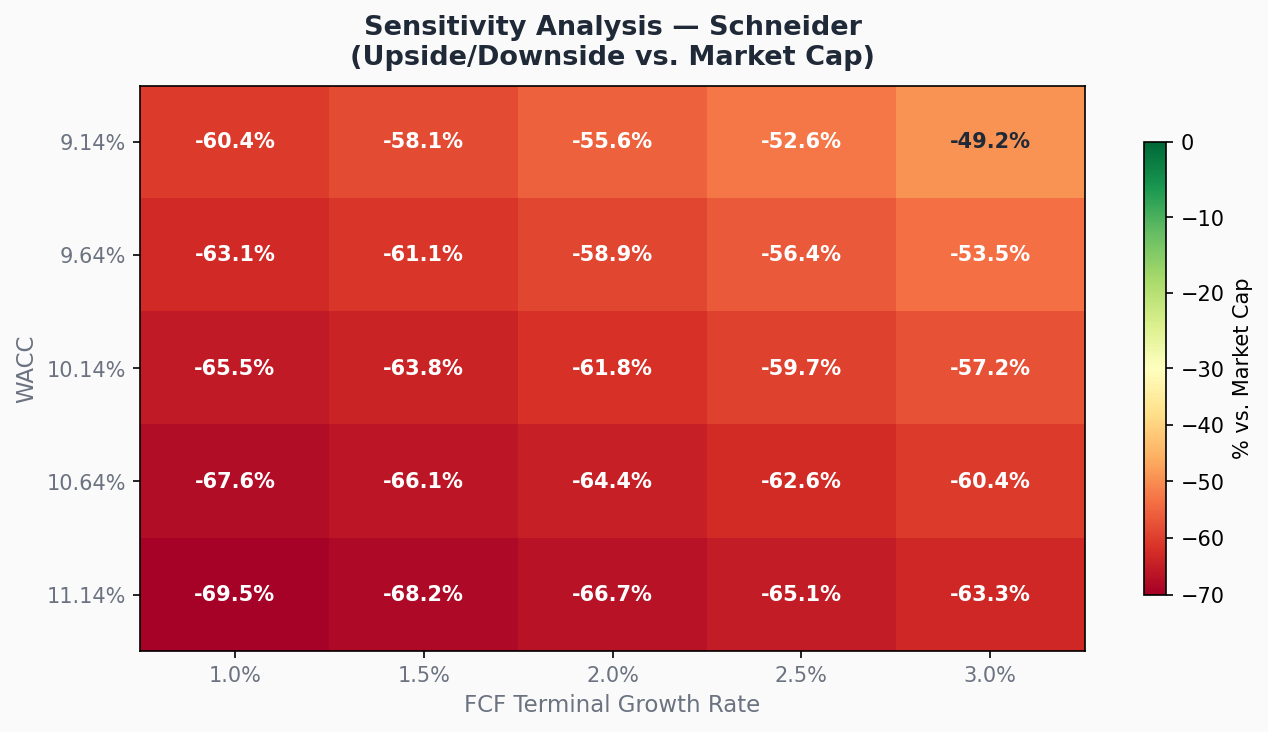
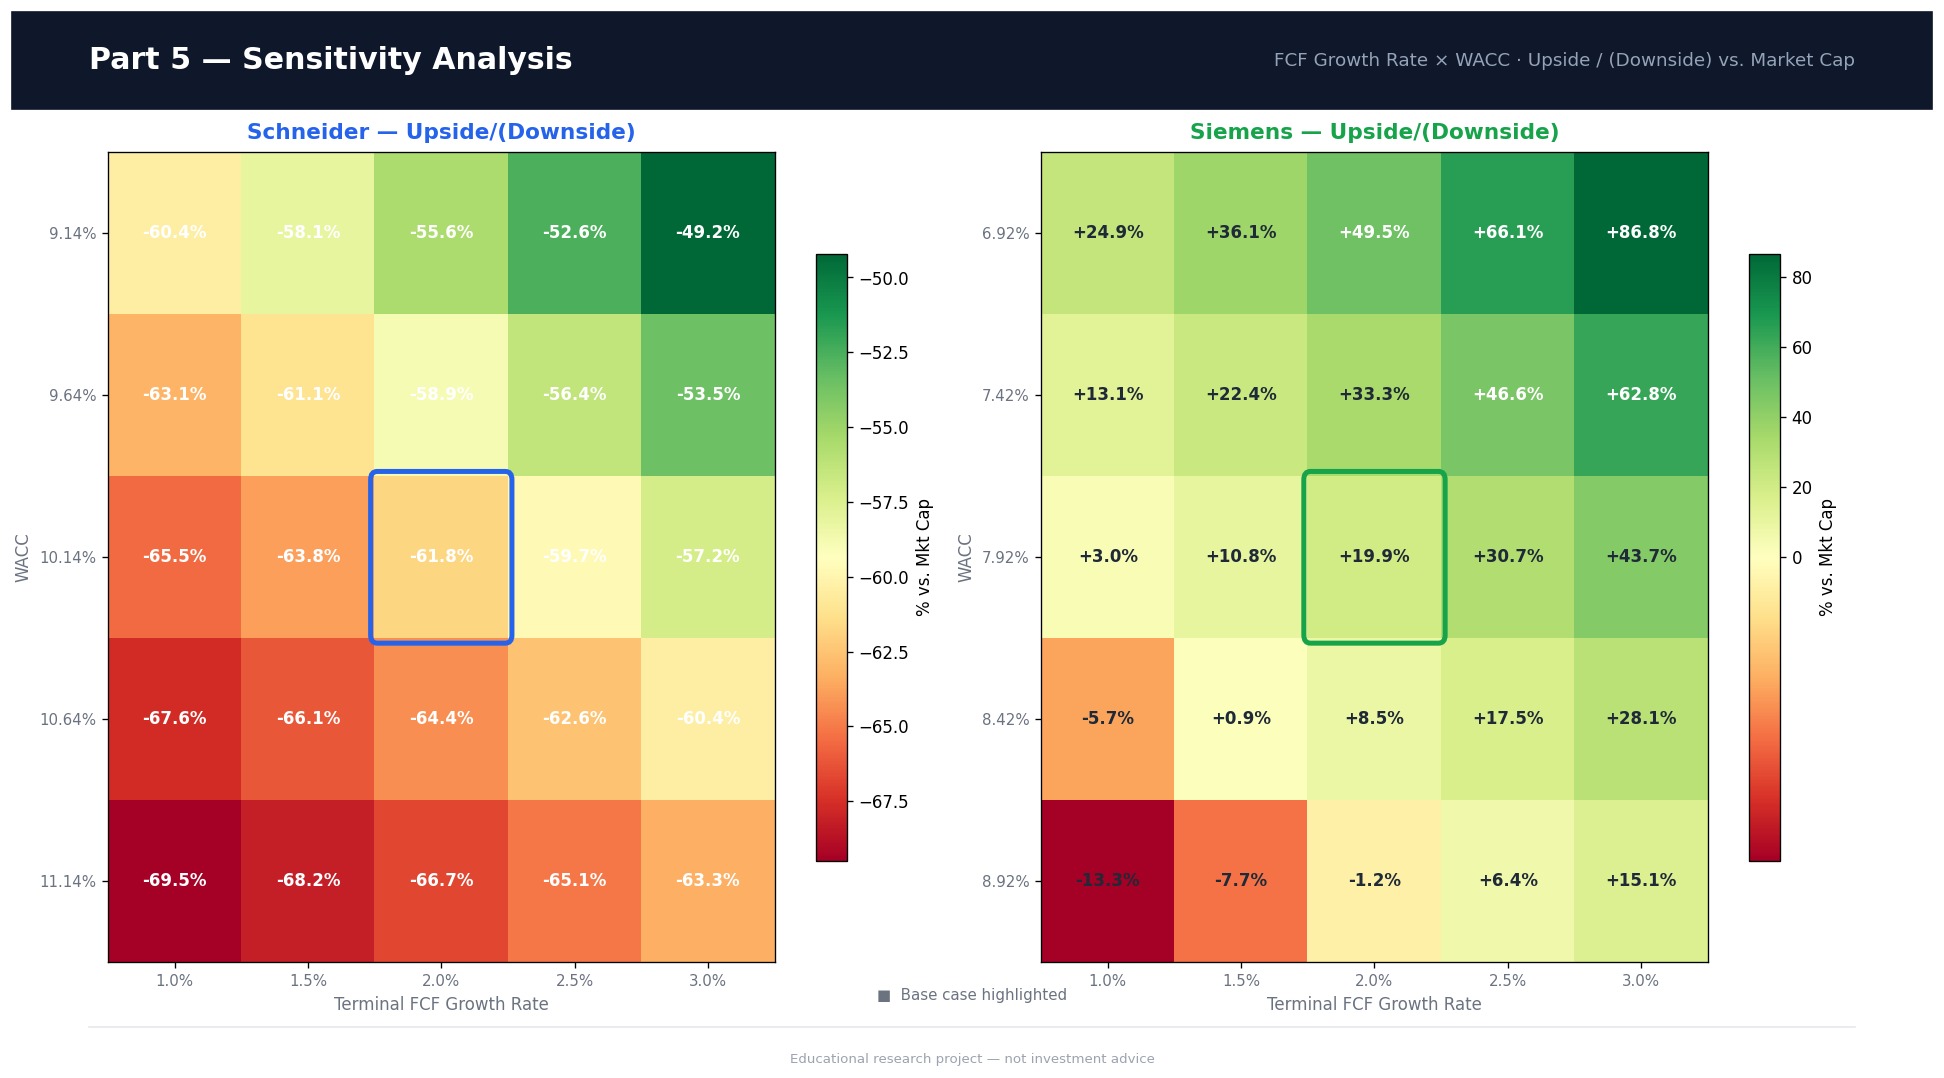
Sensitivity Analysis — How Robust is the Conclusion?
The sensitivity analysis varies the two most important DCF inputs — FCF growth rate and WACC — by ±50–100 basis points simultaneously,
producing a matrix of implied upside/downside scenarios. This tests whether the conclusion is fragile (dependent on optimistic
assumptions) or robust (holds under stress cases).
Schneider: the conclusion is relatively stable under changes to the discount rate but highly sensitive to the growth
assumption. If FCF growth decelerates to ~10% rather than the base case, the implied upside disappears and the stock looks fully
valued or stretched. This confirms that Schneider is a growth-dependent investment.
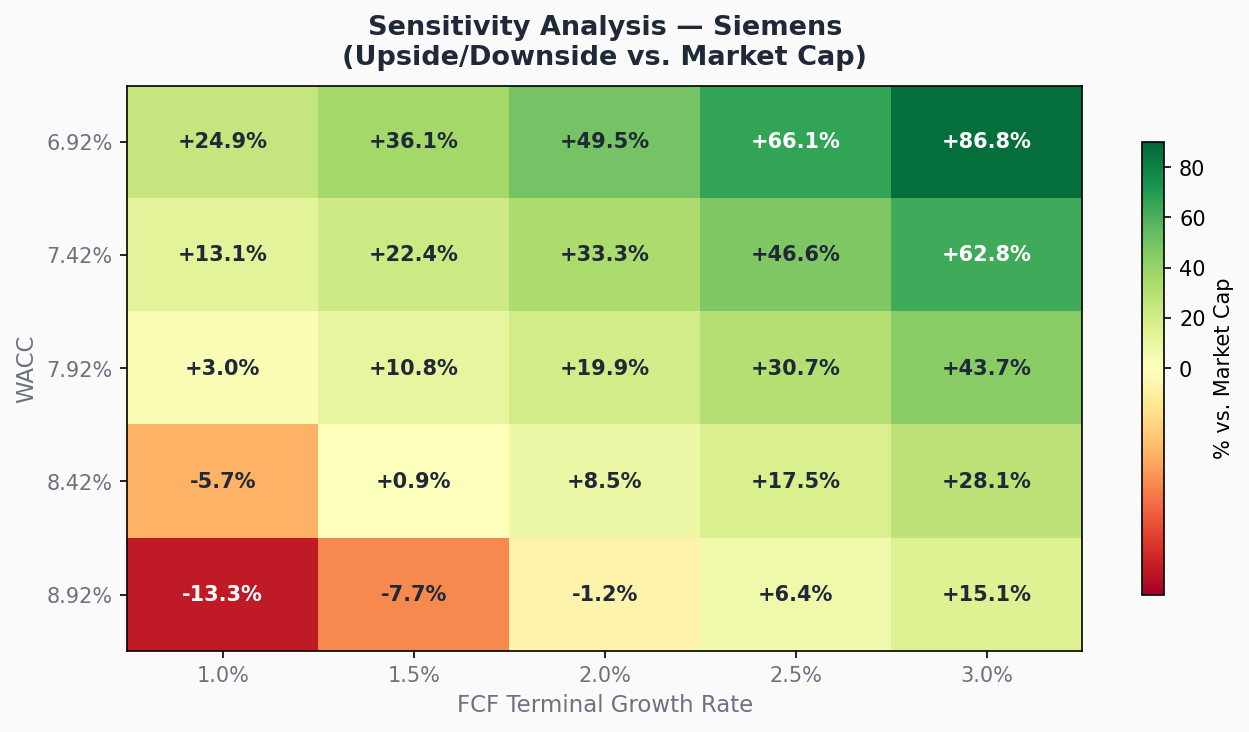
Siemens: the conclusion holds across nearly every scenario in the matrix. Even under a combination of higher WACC
and lower growth, the model continues to suggest the stock trades at or below intrinsic value. That kind of robustness —
limited downside in stress cases and meaningful upside in base and bull cases — is what makes the risk/reward asymmetry compelling.
Schneider: valuation is highly sensitive to the FCF growth assumption. Base case shows ~−62% downside to DCF value.
Siemens: positive upside holds across most stress scenarios. Base case shows ~+20% upside to DCF value.
Exhibits & Slides
Selected exhibits and the slide deck used to present the project. Visuals are designed to summarize the key logic quickly:
sector rationale → financial quality → valuation → conclusion.
The conclusion is Siemens over Schneider on risk/reward at the reference date — not because Siemens is inherently
the better business, but because the market price does not yet reflect the quality of what the business has become. Schneider
remains exceptional, but at a valuation where the investment case is growth-dependent and less forgiving of any execution miss.
Schneider (at ref. price)
Exceptional business quality and earnings visibility
Schneider becomes interesting if: entry price ~20–25% lower, where FCF yield reaches ~4.5% and P/E compresses to ~22–23×.
The conclusion matters less than the process that produced it. The same framework — sector rationale, structured company selection,
rigorous financial statement analysis, ROIC-based value creation assessment, DCF with sensitivity testing — is replicable across
any sector, any market, any time period. The specific stocks are the illustration. The method is the point.
Analysis conducted in late 2024 / early 2025 using publicly available annual report data for FY2018–FY2024. All figures in euros.