MA Framework: Deal Sourcing & Acquisition Screening Engine
A modular Python framework for identifying, screening, and prioritising acquisition targets in the Italian mid-market.
Built for family offices and holding companies, it combines financial analysis, proprietary signals, and deal feasibility
into a structured decision-support system with a local Streamlit dashboard.
Reads company financials from a structured Excel template and computes a full KPI set: revenue CAGR, EBITDA margin, cash conversion, PFN/EBITDA, revenue per head.
Runs five proprietary scoring modules, including a Succession Signal Detector and an Owner Dependency Score, that no commercial tool in this segment offers.
Produces a BUY / WATCH / PASS decision, a valuation range, a deal feasibility assessment, and a PDF report in under 10 seconds per target.
Why it matters
The Italian mid-market is one of the most information-inefficient M&A segments in Europe. Most deals are still sourced through personal networks and managed with Excel.
Over the next 5-10 years, more than 70,000 Italian companies with revenues above €5M will face ownership transitions driven by generational change. A systematic approach to sourcing is the only way to stay ahead of that wave.
The framework runs entirely locally, with no cloud dependency and no recurring cost, making it viable for small teams and individual investors.
Disclaimer: this framework is an analytical tool and does not constitute investment advice. All outputs should be verified against primary sources before any investment decision is made.
Overview: The Problem This Solves
Most M&A analytics tools are built for large-cap, liquid markets. Capital IQ covers millions of companies globally
but offers thin data on Italian SMEs below €50M in revenue. Midaxo and DealCloud manage pipeline CRM at enterprise
prices that start in the tens of thousands per year. Neither is calibrated to the specific dynamics of the Italian
mid-market: family-owned businesses, founder dependency, informal succession processes, financial statements that
require careful reading.
The MA Framework starts from the opposite direction. The core question it tries to answer is the one a family office
or holding company actually asks: is this company worth spending time on, and is now the right moment to approach it?
Everything in the system is built around that.
The pipeline has six layers: data ingestion, KPI calculation, scoring, valuation, feasibility assessment, and output
generation. Each layer is modular and independently testable. The whole thing runs on a local machine with no external
API dependencies, which keeps sensitive deal information off third-party servers and the cost of operation at zero.
Part 1: Architecture
The framework is built in Python and structured around ten modules. The entry point is a structured Excel template,
one file per target company, which feeds the ingestion layer and propagates through the full pipeline.
Multi-dimensional scoring with configurable weights
Score /100 + BUY / WATCH / PASS decision
valuation.py
EV range from sector-calibrated EBITDA multiples
EV min/max, equity min/max, multiple range
feasibility.py
Deal structure and leverage sustainability assessment
FEASIBLE / STRETCHED / HARD + debt capacity
succession.py
Detects generational transition signals from available data
Score /10 + signal list
owner_dependency.py
Estimates founder dependency risk
Score /10 + risk signals
integration_complexity.py
Preliminary integration difficulty index
Score /10 + complexity drivers
acquirer_readiness.py
Scores the acquirer's own readiness across 5 dimensions
Score /100 + PRONTO / QUASI PRONTO / NON PRONTO
pdf_report.py
Generates executive summary or full report in PDF
Professional PDF with charts and tables
All modules are independently testable. The pipeline can be run from CLI via main.py or through the Streamlit dashboard.
The data layer uses SQLite as a local database. Every target analysed can be saved to the pipeline, which enables
persistent ranking, filtering, and comparison across sessions. The schema stores KPIs and scores as both flat columns
for fast querying and JSON blobs for full detail retrieval.
Part 2: The KPI Layer
Financial data is entered through a three-sheet Excel template: anagrafica (company profile), three years of income
statement and balance sheet data, and qualitative inputs. The KPI layer reads rows by label rather than by position,
so the template can be modified without touching the code.
Core KPIs Computed
KPI
Formula
Why It Matters for Italian SMEs
Revenue CAGR
(Rev_n / Rev_0)^(1/n) - 1, dynamic n
Organic growth signal; distinguishes structural growth from one-off gains
EBITDA Margin (avg)
Mean(EBITDA / Revenue) over period
Pricing power proxy; benchmarks vary significantly across manufacturing sub-sectors
EBITDA Margin Trend
Last margin - First margin
Expansion or compression signal; more informative than the average in isolation
Cash Conversion
(EBITDA - Capex - DCCN) / EBITDA
Italian SMEs often show inflated EBITDA; cash conversion separates real from accounting earnings
PFN / EBITDA
(Debt - Cash) / EBITDA_last
Primary leverage metric; negative values indicate net cash, which affects deal structure
Revenue per Head
Revenue_last / Employees_last
Operational productivity proxy; useful for within-sector peer comparisons
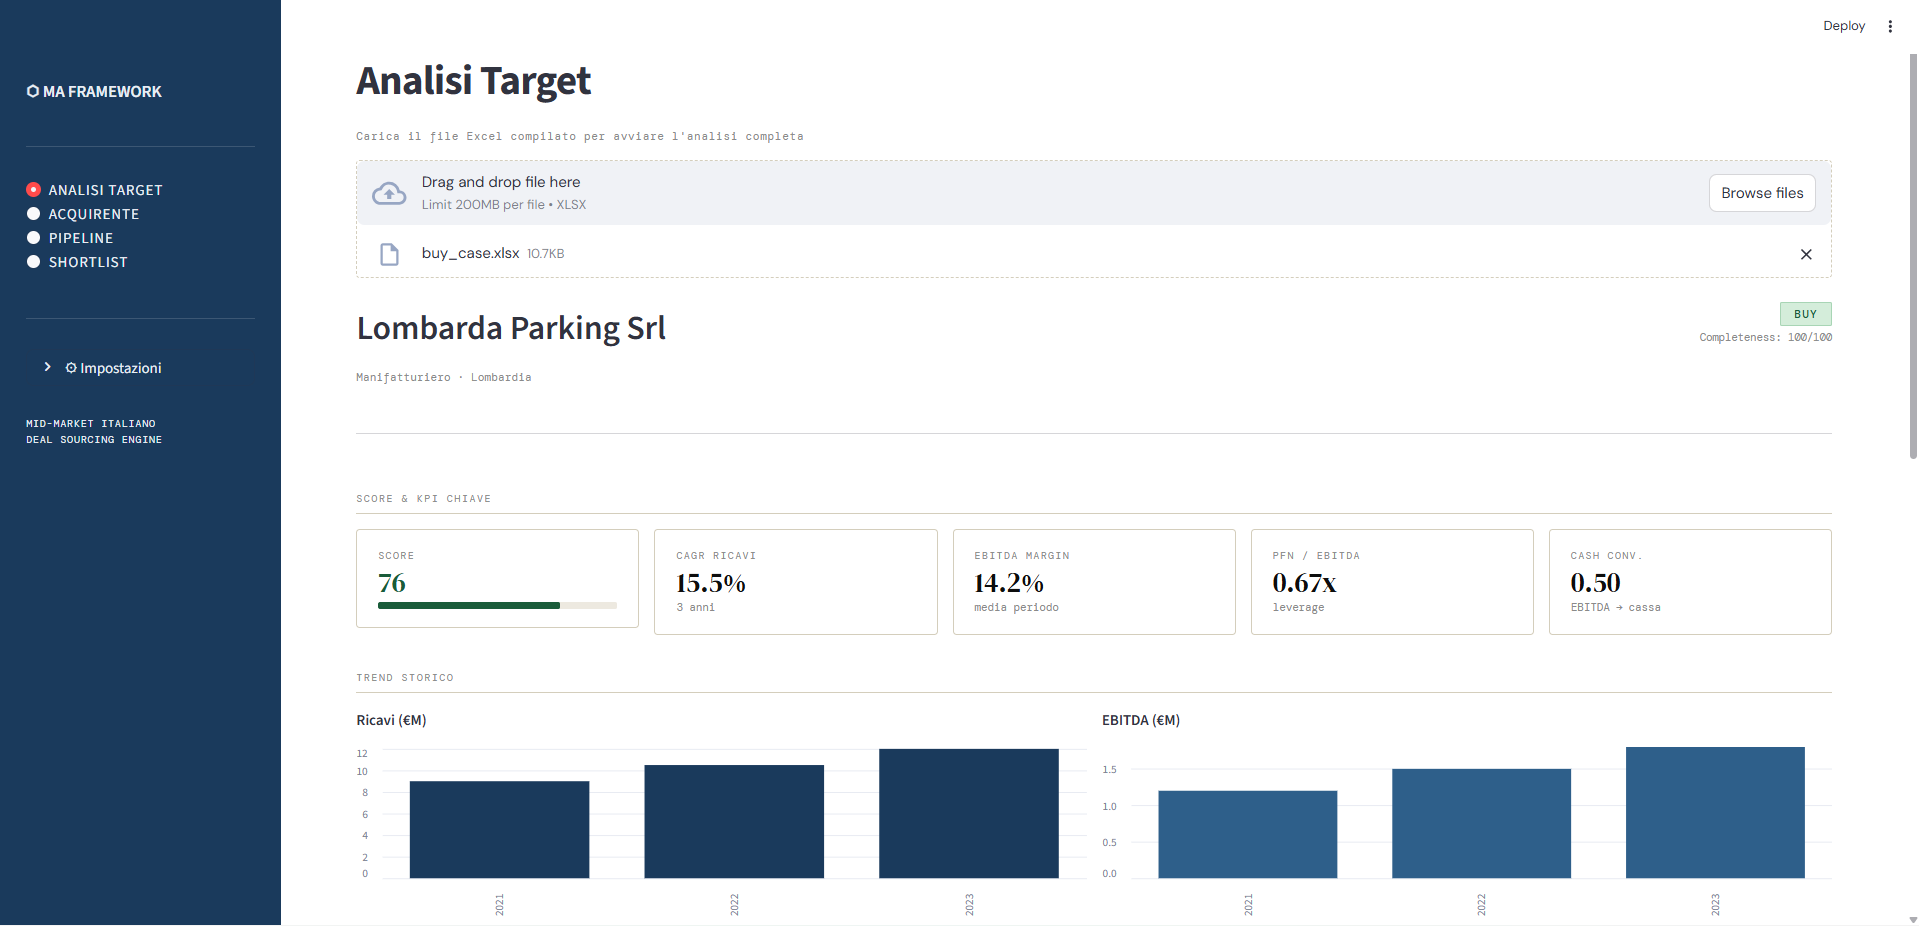
The KPI summary row in the dashboard. The five cards give an immediate read on growth, margins, leverage, and cash quality before diving into the detail.
The completeness score runs at ingestion and ranges from 0 to 100. Missing fields are penalised proportionally,
with financial data weighted more heavily than qualitative inputs. Every output in the dashboard shows the
completeness score of the underlying data, so it is always clear how much to trust the result. A target with 60%
completeness produces a valid score, but the decision label is flagged as provisional.
Part 3: The Scoring Model
The scoring model assigns a composite score from 0 to 100 and maps it to one of three labels: BUY, WATCH, or PASS.
Thresholds and weights are configurable via a YAML settings file. The model can be recalibrated for different
acquirer strategies without touching the codebase.
Scoring Dimensions
Dimension
Max Points
Key Drivers
Business Quality
70
Revenue CAGR, EBITDA margin (avg + trend), leverage, cash conversion, revenue per head (level + trend)
Market / Qualitative
20
Competitive position (1-5), client concentration, export exposure
Acquisition Signal
10
Owner age and succession context, treated as an acquisibility signal rather than a quality penalty
Decision thresholds: BUY ≥ 72, WATCH ≥ 38, PASS < 38. Both are configurable in config/settings.yaml.
One design choice worth explaining is the treatment of founder age. In most screening tools, an older founder reduces
a company's score as a risk factor. Here it works the other way: an older founder without identified successors is
treated as a positive acquisibility signal, because it increases the probability the owner is open to a conversation.
Business quality and ownership context are scored separately and combined transparently.
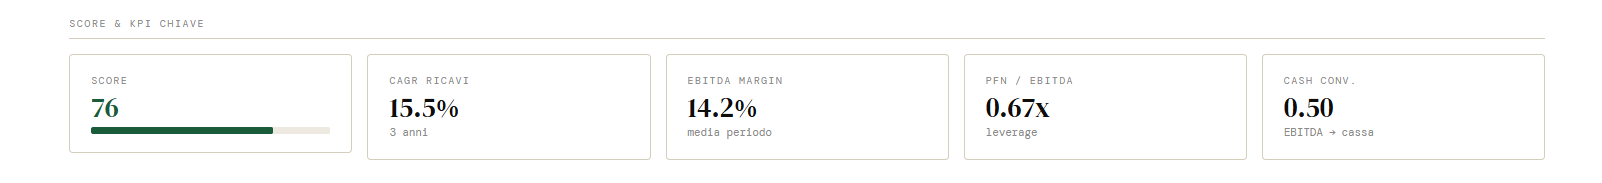
The three proprietary signal modules in the dashboard. Each produces a score out of 10, a label, and a list of specific signals detected from the input data.
Part 4: The Proprietary Modules
The three proprietary modules are the most analytically distinctive part of the framework. None of them exist as
structured outputs in any comparable commercial tool for this market segment.
4.1 Succession Signal Detector
The Italian mid-market over the next decade will be shaped primarily by generational transitions. According to
Cerved and Unioncamere estimates, more than 70,000 companies with revenues above €5M will face ownership changes
driven by founders reaching retirement age without clear successors. The Succession Signal module quantifies this
opportunity systematically from inputs that are either publicly available or easily obtained.
Score inputs: founder age · family members in governance · company age · stated motivation for sale
Output: score /10 + label (ALTO / MEDIO / BASSO) + signal list
Example: founder age 68, no family in board, company founded 1988, motivation = succession → Score: 10/10, ALTO
A target with a high succession signal and a strong financial profile is the ideal entry point for a proactive
approach before the company reaches the formal M&A market, where competition and pricing will both be higher.
4.2 Owner Dependency Score
Many Italian SMEs appear profitable on paper but carry hidden fragility. Commercial relationships, technical knowledge,
and supplier agreements are often concentrated in a single person: the founder. Post-acquisition, this translates
into revenue risk and integration complexity that the financials do not reveal. The module scores this risk from
available inputs including founder age and succession context, client concentration, export exposure, and competitive
positioning.
The distinction between Succession Signal and Owner Dependency is intentional. A high Succession Signal means the
owner is likely ready to sell. A high Owner Dependency Score means the business may be hard to run without them.
A target can score high on both, and that combination is exactly where deal structure and earnout mechanics matter most.
4.3 Integration Complexity Index
Most M&A failures do not happen at screening. They happen post-close, when operational and commercial
incompatibilities surface that were visible in advance but never measured. The Integration Complexity Index produces
a preliminary estimate of how difficult an integration is likely to be, based on sector, client concentration,
export footprint, and competitive positioning.
It is not a due diligence substitute. It is a prioritisation tool: a target with a high financial score and a high
integration complexity score deserves more scrutiny before proceeding, not less.
Part 5: Valuation and Deal Feasibility
The valuation layer applies sector-calibrated EV/EBITDA multiples to produce a preliminary enterprise value range.
Multiples are defined in the settings file and updated as market conditions change. The current calibration reflects
observed transaction multiples in the Italian mid-market for the three target sectors.
Sector
EV/EBITDA Range
EBITDA Margin Benchmark
Max Sustainable Leverage
Manufacturing
4.5x - 8.0x
10%
3.5x EBITDA
Food & Agri
5.5x - 9.0x
12%
3.0x EBITDA
Distribution / Logistics
4.0x - 7.5x
7%
4.0x EBITDA
The feasibility module takes the EV midpoint and estimates how the transaction could be financed given the target's
current leverage position. It outputs three debt capacity scenarios based on 2.5x, 3.5x, and 4.5x EBITDA, derives
the corresponding equity required, and classifies the deal as FEASIBLE, STRETCHED, or HARD. One design decision
worth noting: a negative PFN (net cash position) is treated as a structural positive rather than a penalty.
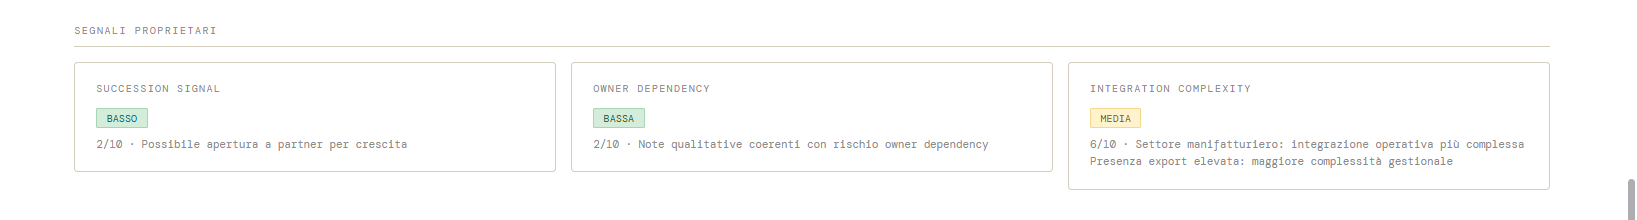
Valuation and feasibility section in the dashboard. The left card shows the EV range and implied equity value. The right card shows the feasibility classification, current leverage, and the three debt capacity scenarios.
Part 6: Acquirer Readiness Score
Most deal screening tools evaluate the target. Almost none evaluate the acquirer. This is a real gap: an attractive
target approached by an unprepared acquirer produces a failed process, a broken relationship, or a deal that closes
but destroys value. The Acquirer Readiness Score addresses this directly.
The module uses a separate Excel template completed by or for the acquirer and scores readiness across five dimensions.
Dimension
Max Points
Key Inputs
Financial Capacity
30
Available equity, current leverage vs. maximum, covenant position, undrawn credit lines
The output is a score from 0 to 100 with one of four labels: PRONTO (≥75), QUASI PRONTO (≥50), NON ANCORA
PRONTO (≥30), or NON PRONTO (<30). The module also generates a list of positive signals and warnings to
help identify which gaps should be addressed before approaching a target.
Used together, the target score and the acquirer readiness score produce a complete picture. Not just whether a
company is worth acquiring, but whether this acquirer is actually ready to do it right now.
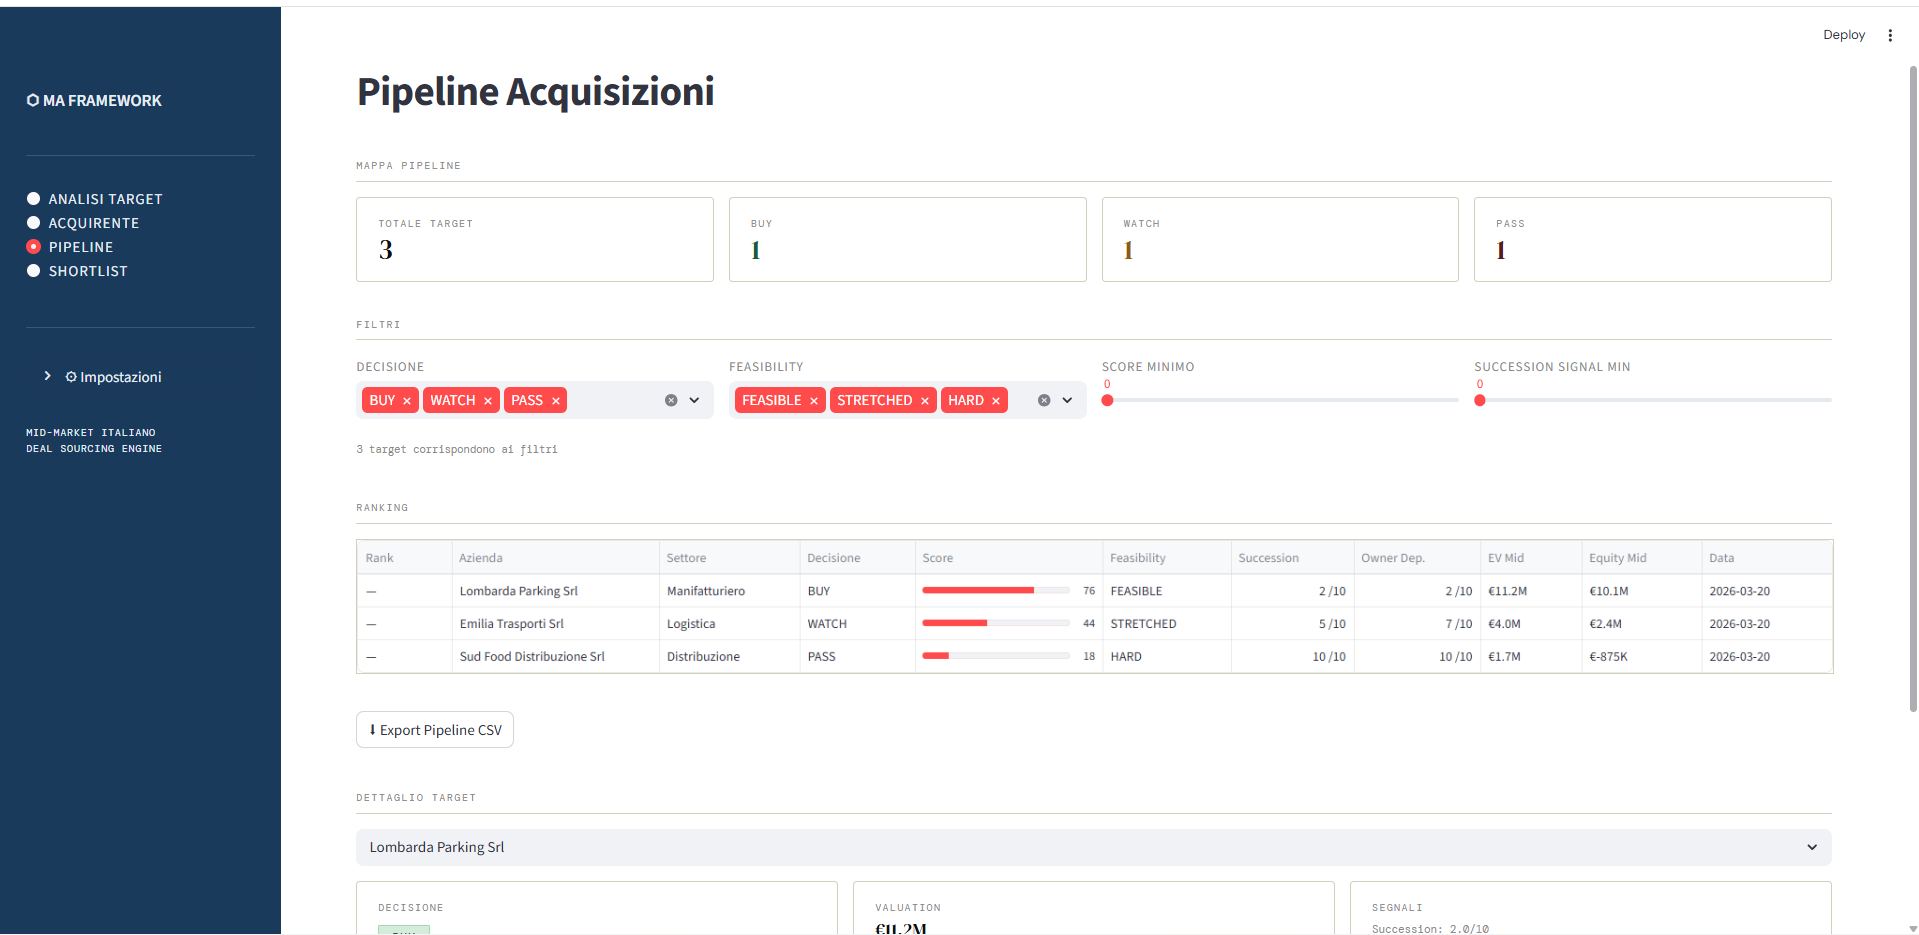
Part 7: Pipeline Management and Dashboard
All analysed targets can be saved to a local SQLite database and managed through the Streamlit dashboard. The
dashboard has four sections: target analysis, acquirer readiness, pipeline, and shortlist.
The pipeline section with interactive filters for decision label, feasibility status, minimum score, and succession signal. The ranking table shows all key metrics alongside each target so comparison is immediate.
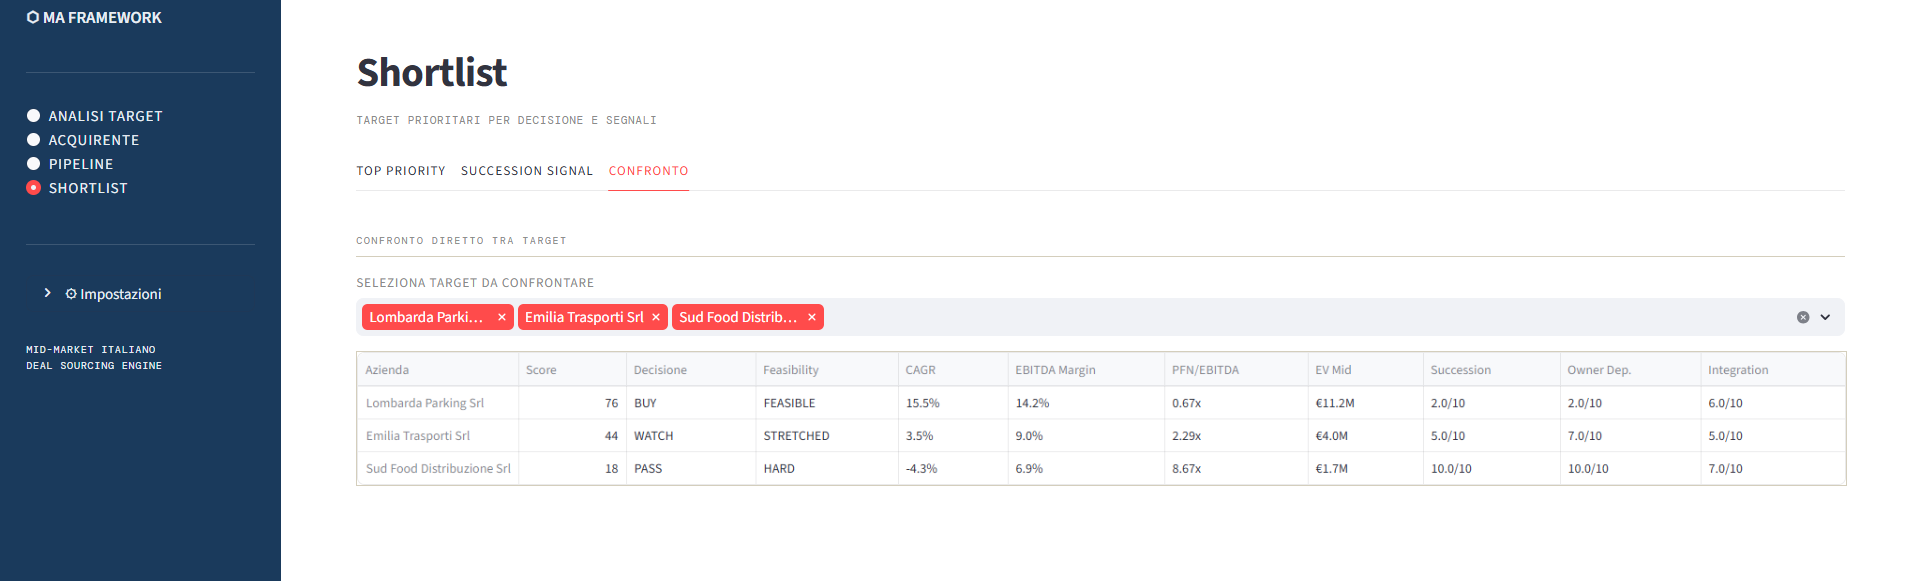
The shortlist section has three views. Top Priority surfaces BUY + FEASIBLE targets. Succession Signal shows all
targets with a succession score above 5/10, regardless of their financial rating, which is useful for proactive
sourcing before companies reach the open market. The Confronto tab lets you place multiple targets side by side
across all metrics.
The comparison tab in the Shortlist section. Multiple targets can be selected and compared across all scoring dimensions in a single table.
The dashboard generates PDF reports in two formats. The executive summary is one page, designed for rapid review.
The full report is multi-page and includes KPI tables, proprietary signal outputs, valuation ranges, feasibility
assessment, and a free-text notes field. Both can be downloaded directly from the dashboard after analysis.
Part 8: Project Files and Setup
The framework runs locally on Windows, macOS, or Linux with Python 3.10+. Four libraries to install, one command to run.
File / Folder
Description
app.py
Streamlit dashboard with four sections: Analisi Target, Acquirente, Pipeline, Shortlist
main.py
CLI entry point for batch processing multiple targets
The current version requires manual compilation of the Excel template. An enrichment module that scrapes public
sources such as CCIAA, company websites, and XrayFinance and pre-fills the template is planned as the next
development phase.
Scoring needs more calibration data
The thresholds are calibrated on sector benchmarks and a small number of real test cases. Running the framework
on 30-50 real targets and comparing outputs against experienced deal judgment would produce more reliable
calibration and surface any systematic biases in the current weights.
No return engine yet
The valuation layer produces an EV range but does not yet model the expected return across holding period
scenarios. A Monte Carlo return engine modelling EBITDA evolution, exit multiple scenarios, and leverage
paydown is the most analytically significant planned extension.
These are real constraints. They do not limit the framework's current utility for first-pass screening and pipeline
management. The system produces consistent, comparable, and documented outputs across targets, which is precisely
what the Italian mid-market M&A process currently lacks.